Q Search the web... g ogle - Yahoo Search Results Ya A Chapter 7 X A webassign.net/web/Student/Assignment-Responses/last?dep=22597272 : Apps bp HP Connected MyLab & Mastering... 6 Yahoo Search Resul... DCYoIcOlaS7L.VTO. An article gave the following observations on maximum concrete pressure (kN/m²). 33.3 41.8 37.4 40.3 36.8 39.2 36.2 41.9 35.8 35.3 40.2 36.0 35.2 36.8 38.9 (a) Is it plausible that this sample was selected from a normal population distribution? O Because of the number of observations, we ascertain that it is plausible that this sample was taken from a normal population distribution. Using a normal probability plot, we ascertain that it is plausible that this sample was taken from a normal population distribution. Because of the number of observations, we ascertain that it is not plausible that this sample was taken from a normal population distribution. Using a normal probability plot, we ascertain that it is not plausible that this sample was taken from a normal population distribution. (b) Calculate an upper confidence bound with confidence level 95% for the population standard deviation of maximum pressure. (Round your answer to three decimal places.) You may need to use the appropriate table in the Appendix of Tables to answer this question. AEB
Q Search the web... g ogle - Yahoo Search Results Ya A Chapter 7 X A webassign.net/web/Student/Assignment-Responses/last?dep=22597272 : Apps bp HP Connected MyLab & Mastering... 6 Yahoo Search Resul... DCYoIcOlaS7L.VTO. An article gave the following observations on maximum concrete pressure (kN/m²). 33.3 41.8 37.4 40.3 36.8 39.2 36.2 41.9 35.8 35.3 40.2 36.0 35.2 36.8 38.9 (a) Is it plausible that this sample was selected from a normal population distribution? O Because of the number of observations, we ascertain that it is plausible that this sample was taken from a normal population distribution. Using a normal probability plot, we ascertain that it is plausible that this sample was taken from a normal population distribution. Because of the number of observations, we ascertain that it is not plausible that this sample was taken from a normal population distribution. Using a normal probability plot, we ascertain that it is not plausible that this sample was taken from a normal population distribution. (b) Calculate an upper confidence bound with confidence level 95% for the population standard deviation of maximum pressure. (Round your answer to three decimal places.) You may need to use the appropriate table in the Appendix of Tables to answer this question. AEB

Mathematics For Machine Technology
8th Edition
ISBN:9781337798310
Author:Peterson, John.
Publisher:Peterson, John.
Chapter65: Achievement Review—section Six
Section: Chapter Questions
Problem 44AR: Solve these prism and cylinder exercises. Where necessary, round the answers to 2 decimal places...

Related questions
Question
Transcribed Image Text:Q Search the web...
g ogle - Yahoo Search Results Ya
A Chapter 7
X
A webassign.net/web/Student/Assignment-Responses/last?dep=22597272
: Apps
bp HP Connected
MyLab & Mastering...
6 Yahoo Search Resul...
DCYoIcOlaS7L.VTO.
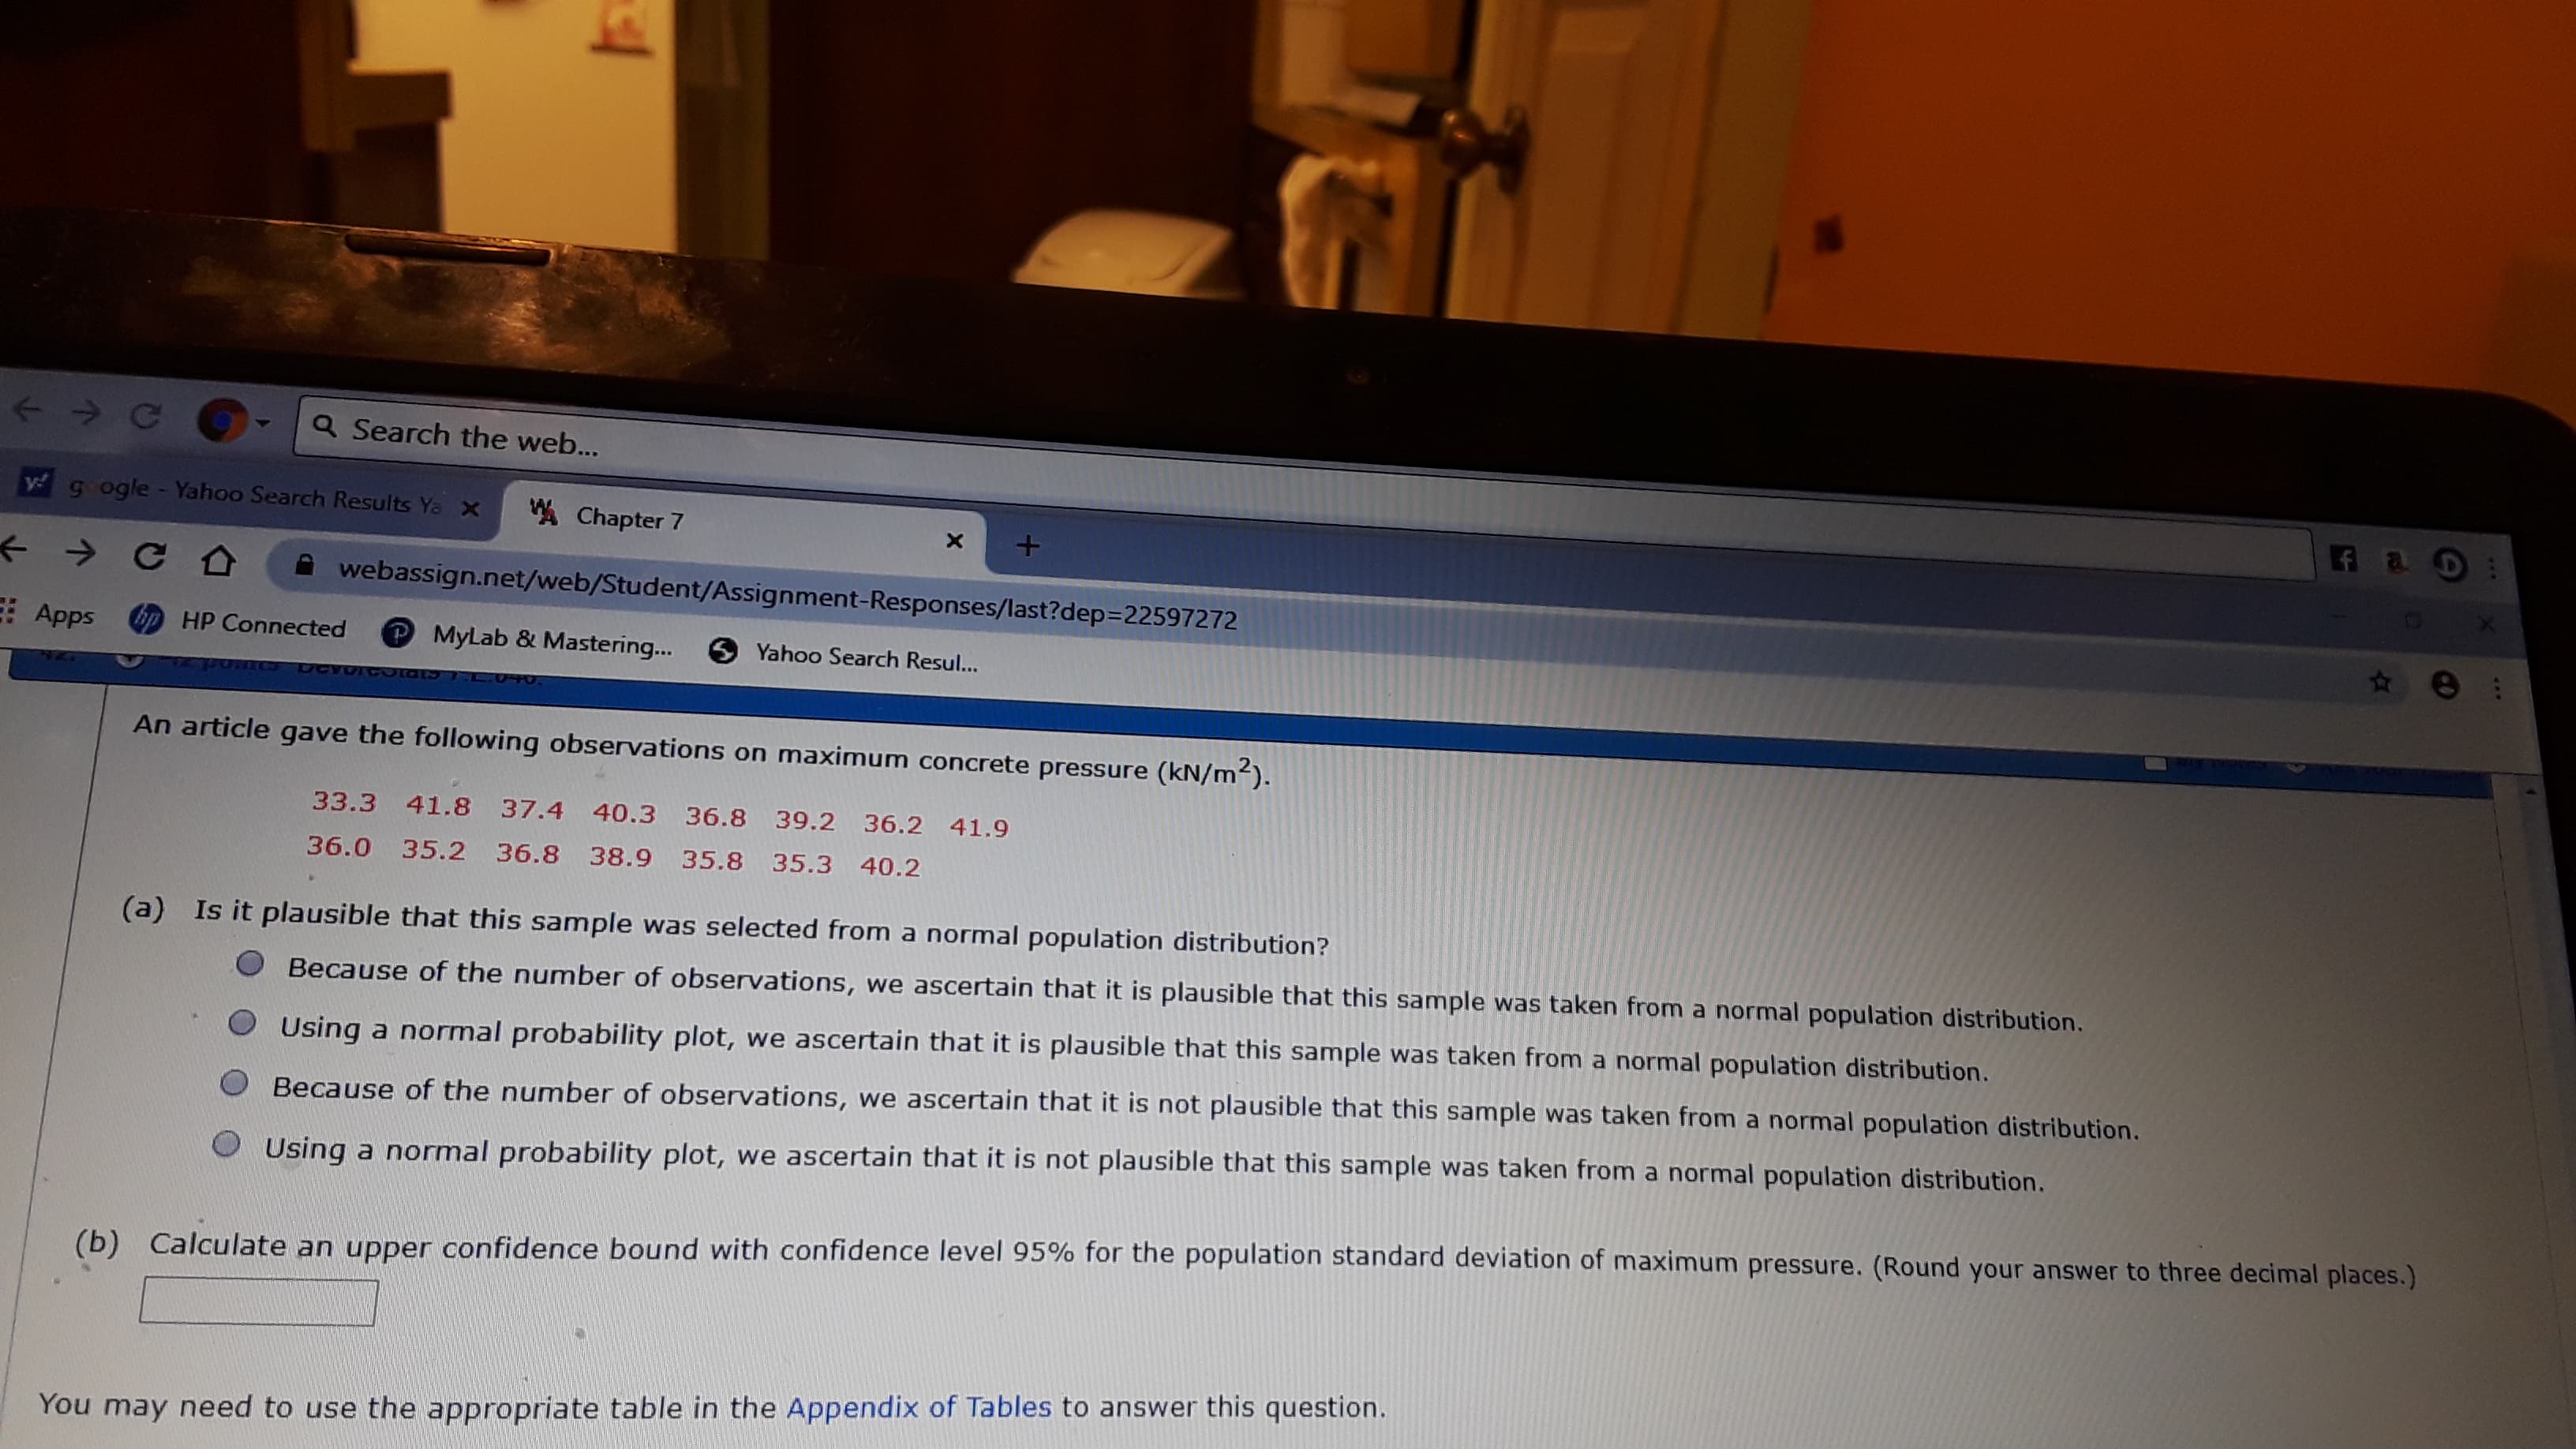
An article gave the following observations on maximum concrete pressure (kN/m²).
33.3 41.8 37.4 40.3 36.8 39.2 36.2 41.9
35.8 35.3 40.2
36.0 35.2 36.8 38.9
(a) Is it plausible that this sample was selected from a normal population distribution?
O Because of the number of observations, we ascertain that it is plausible that this sample was taken from a normal population distribution.
Using a normal probability plot, we ascertain that it is plausible that this sample was taken from a normal population distribution.
Because of the number of observations, we ascertain that it is not plausible that this sample was taken from a normal population distribution.
Using a normal probability plot, we ascertain that it is not plausible that this sample was taken from a normal population distribution.
(b) Calculate an upper confidence bound with confidence level 95% for the population standard deviation of maximum pressure. (Round your answer to three decimal places.)
You may need to use the appropriate table in the Appendix of Tables to answer this question.
AEB
Expert Solution
This question has been solved!
Explore an expertly crafted, step-by-step solution for a thorough understanding of key concepts.

This is a popular solution!

Trending now
This is a popular solution!

Step by step
Solved in 3 steps with 2 images

Recommended textbooks for you
Mathematics For Machine Technology
Advanced Math
ISBN:
9781337798310
Author:
Peterson, John.
Publisher:
Cengage Learning,

Algebra & Trigonometry with Analytic Geometry
Algebra
ISBN:
9781133382119
Author:
Swokowski
Publisher:
Cengage

Algebra: Structure And Method, Book 1
Algebra
ISBN:
9780395977224
Author:
Richard G. Brown, Mary P. Dolciani, Robert H. Sorgenfrey, William L. Cole
Publisher:
McDougal Littell
Mathematics For Machine Technology
Advanced Math
ISBN:
9781337798310
Author:
Peterson, John.
Publisher:
Cengage Learning,
Algebra & Trigonometry with Analytic Geometry
Algebra
ISBN:
9781133382119
Author:
Swokowski
Publisher:
Cengage
Algebra: Structure And Method, Book 1
Algebra
ISBN:
9780395977224
Author:
Richard G. Brown, Mary P. Dolciani, Robert H. Sorgenfrey, William L. Cole
Publisher:
McDougal Littell