Q Search this COL i The College Board provided comparisons of Scholastic Aptitude Test (SAT) scores based on the highest level of education attained by the test taker's parents. A research hypothesis was that students whose parents had attained a higher level of education would on average score higher on the SAT. The overall mean SAT math score was 514. SAT math scores for independent samples of students follow. The first sample shows the SAT math test scores for students whose parents are college graduates with a bachelor's degree. The second sample shows the SAT math test scores for students whose parents are high school graduates but do not have a college degree. Student's Parents College Grads High School Grads 528 432 480 468 592 608 480 492 544 544 468 456 528 576 420 456 544 624 576 576 464 624 552 396 544 464 656 640 their a. Formulate the hypotheses that can be used to determine whether the sample data support the hypothesis that students show a higher population mean math score on the SAT parents attained a higher level of education. #1 = population mean verbal score parents college grads. H2= population mean verbal score parents high school grads. Ho : F1 — H? | s - 0 Ha: H1-H2 -H4₂ > 0 b. What is the point estimate of the difference between the means for the two populations? (to 1 decimal) if parents are college grads. 72 points higher c. Compute the p-value for the hypothesis test. X 3.030 (to 3 decimals) t-value 26 (round your answer to next whole number) Degrees of freedom
Q Search this COL i The College Board provided comparisons of Scholastic Aptitude Test (SAT) scores based on the highest level of education attained by the test taker's parents. A research hypothesis was that students whose parents had attained a higher level of education would on average score higher on the SAT. The overall mean SAT math score was 514. SAT math scores for independent samples of students follow. The first sample shows the SAT math test scores for students whose parents are college graduates with a bachelor's degree. The second sample shows the SAT math test scores for students whose parents are high school graduates but do not have a college degree. Student's Parents College Grads High School Grads 528 432 480 468 592 608 480 492 544 544 468 456 528 576 420 456 544 624 576 576 464 624 552 396 544 464 656 640 their a. Formulate the hypotheses that can be used to determine whether the sample data support the hypothesis that students show a higher population mean math score on the SAT parents attained a higher level of education. #1 = population mean verbal score parents college grads. H2= population mean verbal score parents high school grads. Ho : F1 — H? | s - 0 Ha: H1-H2 -H4₂ > 0 b. What is the point estimate of the difference between the means for the two populations? (to 1 decimal) if parents are college grads. 72 points higher c. Compute the p-value for the hypothesis test. X 3.030 (to 3 decimals) t-value 26 (round your answer to next whole number) Degrees of freedom

Glencoe Algebra 1, Student Edition, 9780079039897, 0079039898, 2018
18th Edition
ISBN:9780079039897
Author:Carter
Publisher:Carter
Chapter10: Statistics
Section10.6: Summarizing Categorical Data
Problem 10CYU

Related questions
Question
Just need part c please
Transcribed Image Text:Q Search this course
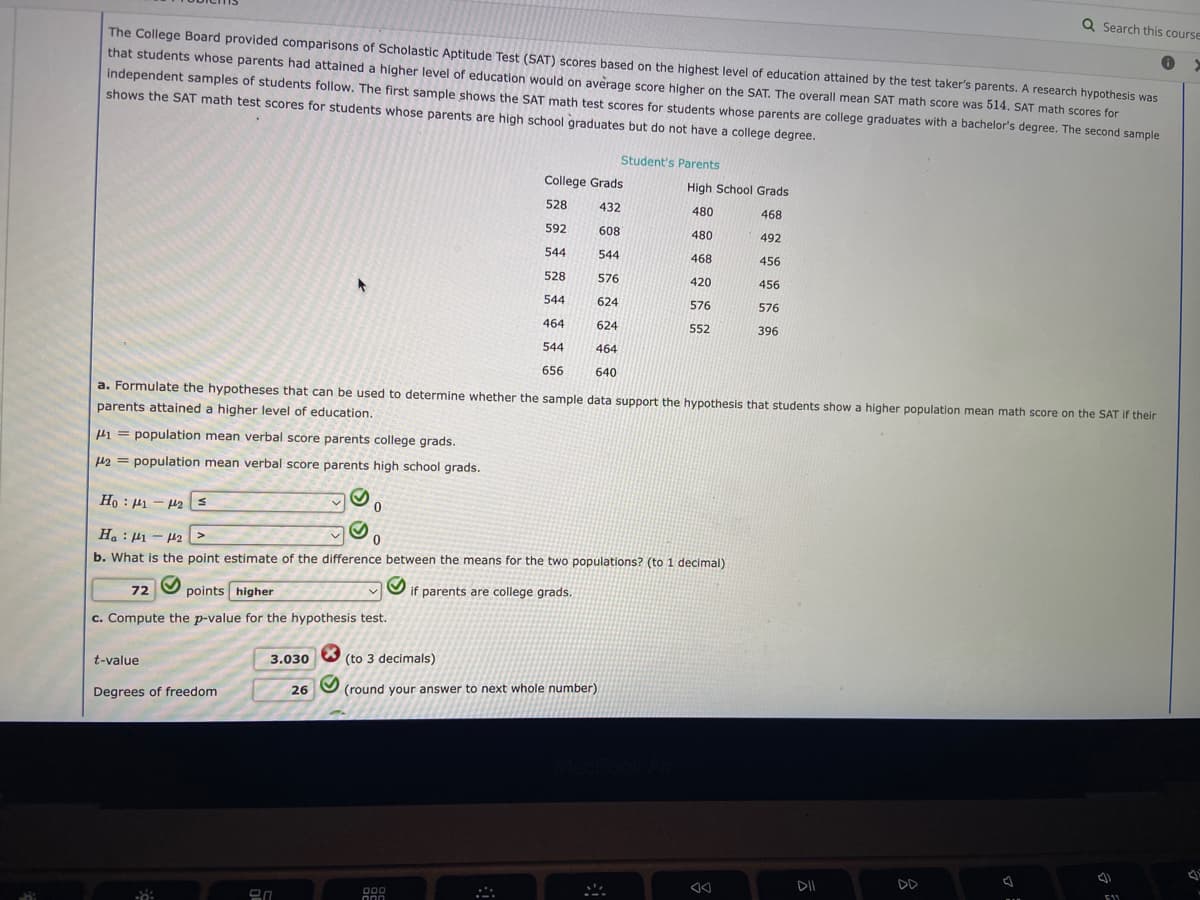
The College Board provided comparisons of Scholastic Aptitude Test (SAT) scores based on the highest level of education attained by the test taker's parents. A research hypothesis was
that students whose parents had attained a higher level of education would on average score higher on the SAT. The overall mean SAT math score was 514. SAT math scores for
independent samples of students follow. The first sample shows the SAT math test scores for students whose parents are college graduates with a bachelor's degree. The second sample
shows the SAT math test scores for students whose parents are high school graduates but do not have a college degree.
Student's Parents
College Grads
High School Grads
480
528
432
468
592
608
480
492
544
544
468
456
528
576
420
456
544
624
576
576
464
624
552
396
544
464
656
640
a. Formulate the hypotheses that can be used to determine whether the sample data support the hypothesis that students show a higher population mean math score on the SAT if their
parents attained a higher level of education.
1 population mean verbal score parents college grads.
=
= population mean verbal score parents high school grads.
Ho : 11 – 12 5
0
Ha 1-2 >
b. What is the point estimate of the difference between the means for the two populations? (to 1 decimal)
S
S
72
points higher
if parents are college grads.
c. Compute the p-value for the hypothesis test.
3.030
(to 3 decimals)
t-value
26
(round your answer to next whole number)
Degrees of freedom
F11
000
000
20
DII
Expert Solution
This question has been solved!
Explore an expertly crafted, step-by-step solution for a thorough understanding of key concepts.

Step by step
Solved in 2 steps with 1 images

Recommended textbooks for you
Glencoe Algebra 1, Student Edition, 9780079039897…
Algebra
ISBN:
9780079039897
Author:
Carter
Publisher:
McGraw Hill

Holt Mcdougal Larson Pre-algebra: Student Edition…
Algebra
ISBN:
9780547587776
Author:
HOLT MCDOUGAL
Publisher:
HOLT MCDOUGAL

Glencoe Algebra 1, Student Edition, 9780079039897…
Algebra
ISBN:
9780079039897
Author:
Carter
Publisher:
McGraw Hill
Holt Mcdougal Larson Pre-algebra: Student Edition…
Algebra
ISBN:
9780547587776
Author:
HOLT MCDOUGAL
Publisher:
HOLT MCDOUGAL