Q: The mean of 100 observations is 50. If one of the observations which was 50 is replaced by 150, Find the resulting mean..
Q: The mean of 100 observations is 50. If one of the observations which was 50 is replaced by 150, Find the resulting mean..

Mathematics For Machine Technology
8th Edition
ISBN:9781337798310
Author:Peterson, John.
Publisher:Peterson, John.
Chapter29: Tolerance, Clearance, And Interference
Section: Chapter Questions
Problem 16A: Spacers are manufactured to the mean dimension and tolerance shown in Figure 29-12. An inspector...

Related questions
Question
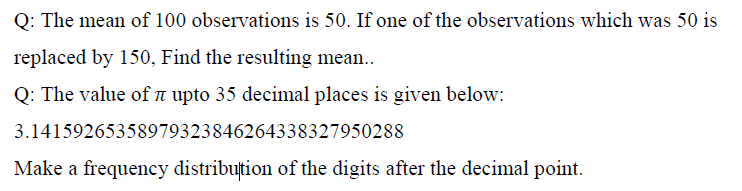
Transcribed Image Text:Q: The mean of 100 observations is 50. If one of the observations which was 50 is
replaced by 150, Find the resulting mean..
Q: The value of upto 35 decimal places is given below:
3.14159265358979323846264338327950288
Make a frequency distribution of the digits after the decimal point.
Expert Solution
This question has been solved!
Explore an expertly crafted, step-by-step solution for a thorough understanding of key concepts.

Step by step
Solved in 2 steps

Recommended textbooks for you
Mathematics For Machine Technology
Advanced Math
ISBN:
9781337798310
Author:
Peterson, John.
Publisher:
Cengage Learning,

Glencoe Algebra 1, Student Edition, 9780079039897…
Algebra
ISBN:
9780079039897
Author:
Carter
Publisher:
McGraw Hill
Mathematics For Machine Technology
Advanced Math
ISBN:
9781337798310
Author:
Peterson, John.
Publisher:
Cengage Learning,
Glencoe Algebra 1, Student Edition, 9780079039897…
Algebra
ISBN:
9780079039897
Author:
Carter
Publisher:
McGraw Hill