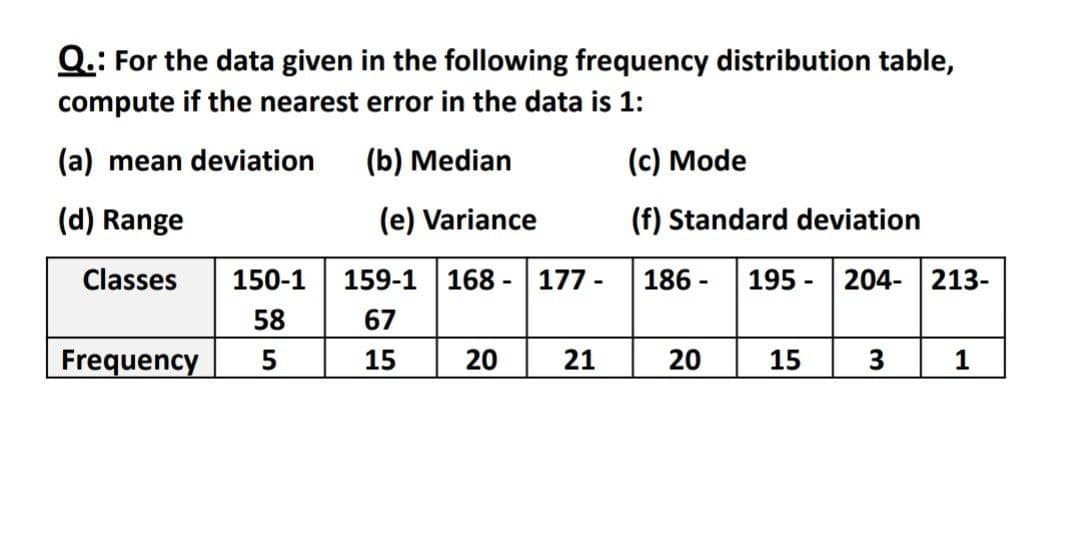
Q.: For the data given in the following frequency distribution table, compute if the nearest error in the data is 1: (a) mean deviation (b) Median (c) Mode (d) Range (e) Variance (f) Standard deviation Classes 150-1 159-1 168-177- 186- 195 204-213- 58 67 Frequency 5 15 20 21 20 15 3 1
Q.: For the data given in the following frequency distribution table, compute if the nearest error in the data is 1: (a) mean deviation (b) Median (c) Mode (d) Range (e) Variance (f) Standard deviation Classes 150-1 159-1 168-177- 186- 195 204-213- 58 67 Frequency 5 15 20 21 20 15 3 1

Glencoe Algebra 1, Student Edition, 9780079039897, 0079039898, 2018
18th Edition
ISBN:9780079039897
Author:Carter
Publisher:Carter
Chapter10: Statistics
Section10.5: Comparing Sets Of Data
Problem 14PPS

Related questions
Question
Transcribed Image Text:Q.: For the data given in the following frequency distribution table,
compute if the nearest error in the data is 1:
(a) mean deviation
(b) Median
(c) Mode
(d) Range
(e) Variance
(f) Standard deviation
Classes 150-1
168 -
186- 195 204-213-
-
58
Frequency 5
20
20
15
3
1
159-1
67
15
177-
21
Expert Solution
This question has been solved!
Explore an expertly crafted, step-by-step solution for a thorough understanding of key concepts.

Step by step
Solved in 4 steps with 7 images

Recommended textbooks for you
Glencoe Algebra 1, Student Edition, 9780079039897…
Algebra
ISBN:
9780079039897
Author:
Carter
Publisher:
McGraw Hill
Glencoe Algebra 1, Student Edition, 9780079039897…
Algebra
ISBN:
9780079039897
Author:
Carter
Publisher:
McGraw Hill