The heights (to the nearest inch) of 30 males are shown below. Construct a frequency distribution and a fre histogram of the data using 5 classes. Describe the shape of the histogram as symmetric, uniform, negative positively skewed, or none of these. 67 76 69 68 75 68 65 63 76 69 66 72 65 66 69 73 62 62 71 73 72 71 65 69 74 70 69 70 66 72 D
The heights (to the nearest inch) of 30 males are shown below. Construct a frequency distribution and a fre histogram of the data using 5 classes. Describe the shape of the histogram as symmetric, uniform, negative positively skewed, or none of these. 67 76 69 68 75 68 65 63 76 69 66 72 65 66 69 73 62 62 71 73 72 71 65 69 74 70 69 70 66 72 D

Glencoe Algebra 1, Student Edition, 9780079039897, 0079039898, 2018
18th Edition
ISBN:9780079039897
Author:Carter
Publisher:Carter
Chapter10: Statistics
Section10.4: Distributions Of Data
Problem 19PFA

Related questions
Question
Transcribed Image Text:P Do Homework - Homework (Section
Homework: Homework (Section 2.3)
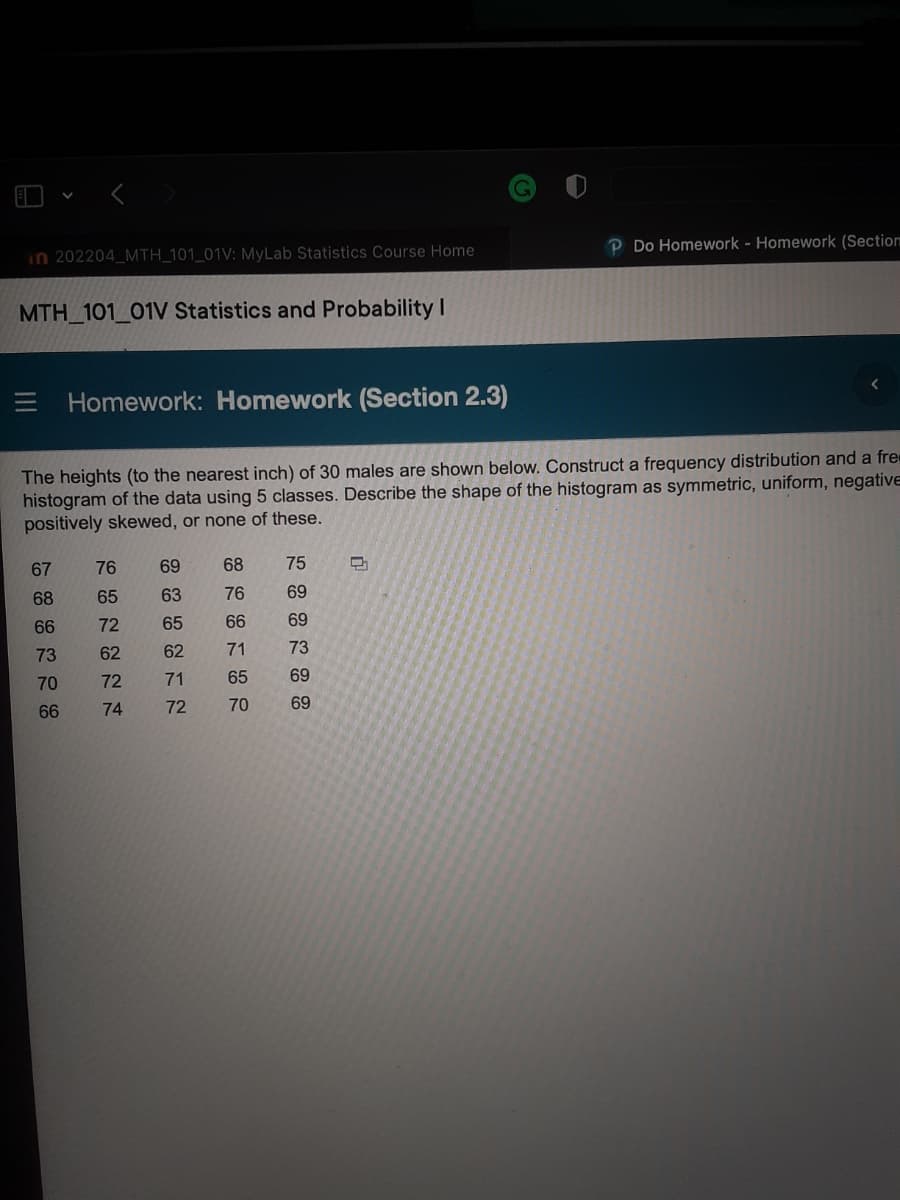
The heights (to the nearest inch) of 30 males are shown below. Construct a frequency distribution and a fre
histogram of the data using 5 classes. Describe the shape of the histogram as symmetric, uniform, negative
positively skewed, or none of these.
67
76
69
68
75
D
68
63
76
69
66
65
66
69
73
62
71
73
70
71
65
69
70
69
66
in 202204_MTH_101_01V: MyLab Statistics Course Home
MTH_101_01V Statistics and Probability I
GENENN
65
62
72
72
Transcribed Image Text:on.com
Answered: What is the student's weighted mean... | bar...
05/23/22 6:40 PM
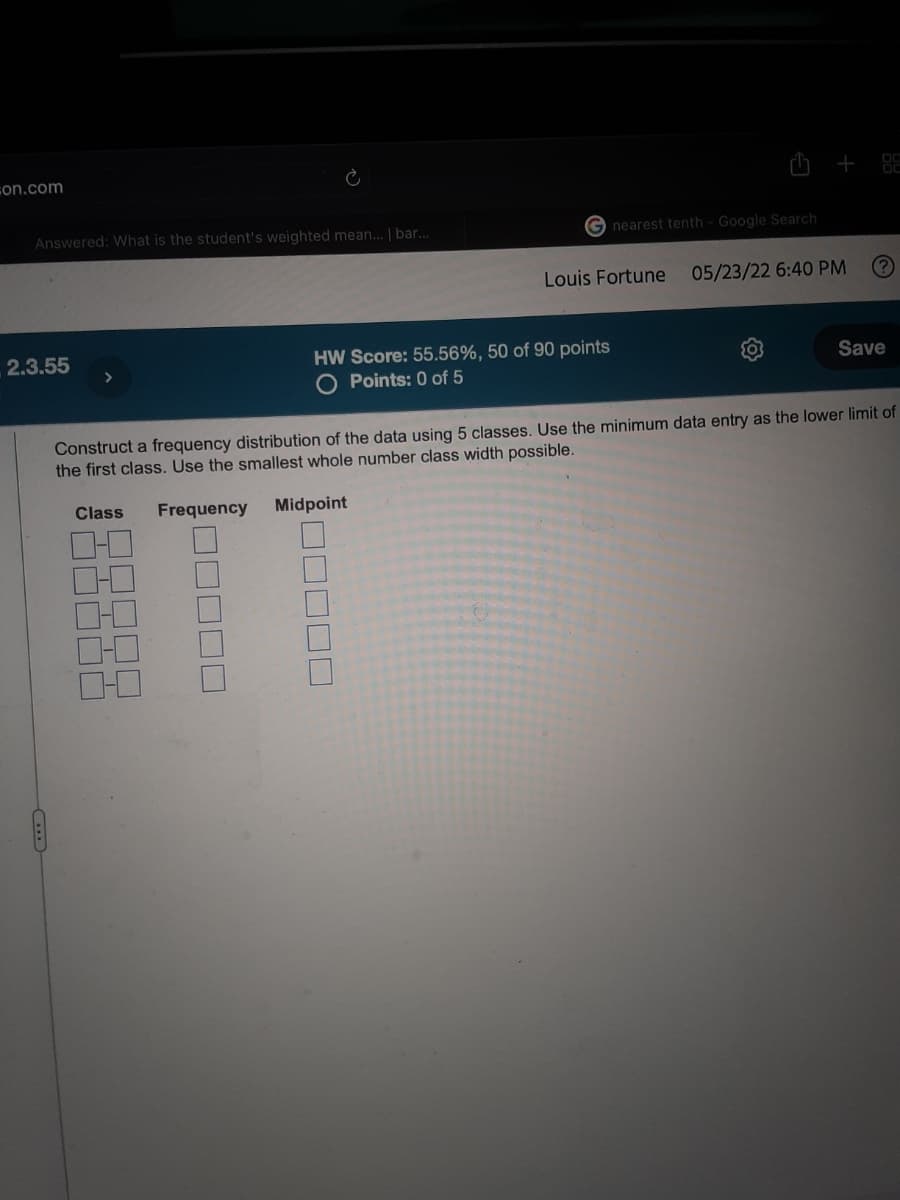
2.3.55
HW Score: 55.56%, 50 of 90 points
O Points: 0 of 5
Save
Construct a frequency distribution of the data using 5 classes. Use the minimum data entry as the lower limit of
the first class. Use the smallest whole number class width possible.
Class Frequency Midpoint
01
☐☐☐☐☐
Gnearest tenth - Google Search
+88
Louis Fortune
Expert Solution
This question has been solved!
Explore an expertly crafted, step-by-step solution for a thorough understanding of key concepts.

This is a popular solution!

Trending now
This is a popular solution!

Step by step
Solved in 2 steps with 2 images

Recommended textbooks for you
Glencoe Algebra 1, Student Edition, 9780079039897…
Algebra
ISBN:
9780079039897
Author:
Carter
Publisher:
McGraw Hill
Glencoe Algebra 1, Student Edition, 9780079039897…
Algebra
ISBN:
9780079039897
Author:
Carter
Publisher:
McGraw Hill