question A manufacturer is developing a facility plan to provide production capacity for the factory. the amount of capacity required in the future depends on the number of products demanded by its customers. The data below reflect past sales of its products. a) use simple linear regression to forecast annual demand for the products for each of the nnext 3 years. b) determine the correlation coefficient for the data and interpret its meaning. c) find the coefficient of determination for the data and interprete its meaning. year annual sales (number of products year annual sales (number of products) 1 490 5 461 2 487 6 475 3 492 7 472 4 478 8 458
question A manufacturer is developing a facility plan to provide production capacity for the factory. the amount of capacity required in the future depends on the number of products demanded by its customers. The data below reflect past sales of its products. a) use simple linear regression to forecast annual demand for the products for each of the nnext 3 years. b) determine the correlation coefficient for the data and interpret its meaning. c) find the coefficient of determination for the data and interprete its meaning. year annual sales (number of products year annual sales (number of products) 1 490 5 461 2 487 6 475 3 492 7 472 4 478 8 458
Contemporary Marketing
18th Edition
ISBN:9780357033777
Author:Louis E. Boone, David L. Kurtz
Publisher:Louis E. Boone, David L. Kurtz
Chapter14: Pricing Strategies
Section14.2: Forecasting Demand
Problem 1LO
Related questions
Question
question
A manufacturer is developing a facility plan to provide production capacity for the factory. the amount of capacity required in the future depends on the number of products demanded by its customers. The data below reflect past sales of its products.
a) use simple linear regression to
b) determine the correlation coefficient for the data and interpret its meaning.
c) find the coefficient of determination for the data and interprete its meaning.
| year | annual sales (number of products | year | annual sales (number of products) |
| 1 | 490 | 5 | 461 |
| 2 | 487 | 6 | 475 |
| 3 | 492 | 7 | 472 |
| 4 | 478 | 8 | 458 |
Expert Solution
This question has been solved!
Explore an expertly crafted, step-by-step solution for a thorough understanding of key concepts.
Step by step
Solved in 4 steps with 5 images

Follow-up Questions
Read through expert solutions to related follow-up questions below.
Follow-up Question

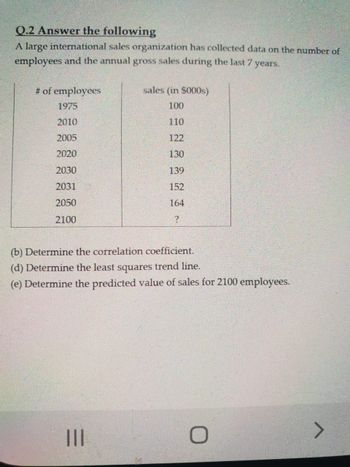
Transcribed Image Text:Q.2 Answer the following
A large international sales organization has collected data on the number of
employees and the annual gross sales during the last 7 years.
# of employees
sales (in $000s)
1975
100
2010
110
2005
122
2020
130
2030
139
2031
152
2050
164
2100
?
(b) Determine the correlation coefficient.
(d) Determine the least squares trend line.
(e) Determine the predicted value of sales for 2100 employees.
|||
>
Solution
Recommended textbooks for you

Contemporary Marketing
Marketing
ISBN:
9780357033777
Author:
Louis E. Boone, David L. Kurtz
Publisher:
Cengage Learning

Marketing
Marketing
ISBN:
9780357033791
Author:
Pride, William M
Publisher:
South Western Educational Publishing

Contemporary Marketing
Marketing
ISBN:
9780357033777
Author:
Louis E. Boone, David L. Kurtz
Publisher:
Cengage Learning

Marketing
Marketing
ISBN:
9780357033791
Author:
Pride, William M
Publisher:
South Western Educational Publishing