Q.3) Which of the following sets of four numbers has the largest standard deviation? (a) 100, 101, 102, 103 (b) 7, 8, 9, 10 (c) 5, 5, 5, 5 (d) 0, 1, 2, 3 (e) 0, 0, 10, 10
Q.3) Which of the following sets of four numbers has the largest standard deviation? (a) 100, 101, 102, 103 (b) 7, 8, 9, 10 (c) 5, 5, 5, 5 (d) 0, 1, 2, 3 (e) 0, 0, 10, 10

Glencoe Algebra 1, Student Edition, 9780079039897, 0079039898, 2018
18th Edition
ISBN:9780079039897
Author:Carter
Publisher:Carter
Chapter10: Statistics
Section10.4: Distributions Of Data
Problem 19PFA

Related questions
Question
I need the answer at 20 minute
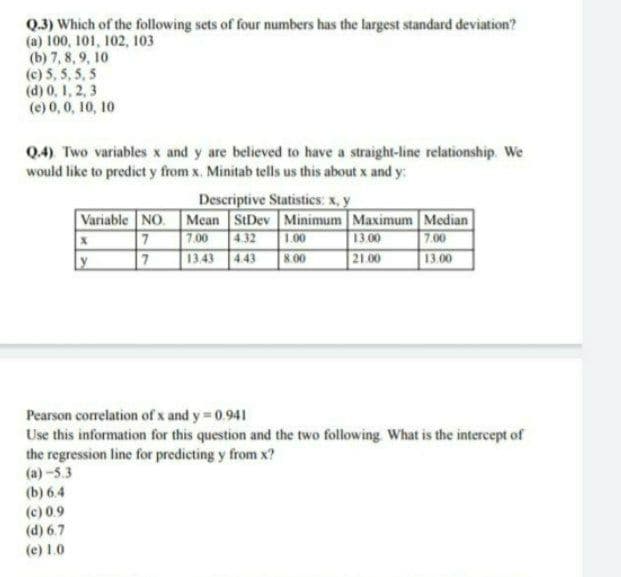
Transcribed Image Text:Q.3) Which of the following sets of four numbers has the largest standard deviation?
(a) 100, 101, 102, 103
(b) 7, 8, 9, 10
(c) 5, 5, 5, 5
(d) 0, 1, 2, 3
(e) 0,0, 10, 10
Q.4) Two variables x and y are believed to have a straight-line relationship. We
would like to predict y from x. Minitab tells us this about x and y:
Descriptive Statistics: x, y
Variable NO. Mean StDev Minimum Maximum Median
4.32
7.00
1.00
13 00
7.00
y
13.43
21.00
13.00
4.43
8.00
Pearson correlation of x and y 0.941
Use this information for this question and the two following What is the intercept of
the regression line for predicting y from x?
(a)-5.3
(b) 6.4
(c) 0.9
(d) 6.7
(e) 1.0
Expert Solution
This question has been solved!
Explore an expertly crafted, step-by-step solution for a thorough understanding of key concepts.

This is a popular solution!

Trending now
This is a popular solution!

Step by step
Solved in 2 steps

Recommended textbooks for you
Glencoe Algebra 1, Student Edition, 9780079039897…
Algebra
ISBN:
9780079039897
Author:
Carter
Publisher:
McGraw Hill
Glencoe Algebra 1, Student Edition, 9780079039897…
Algebra
ISBN:
9780079039897
Author:
Carter
Publisher:
McGraw Hill