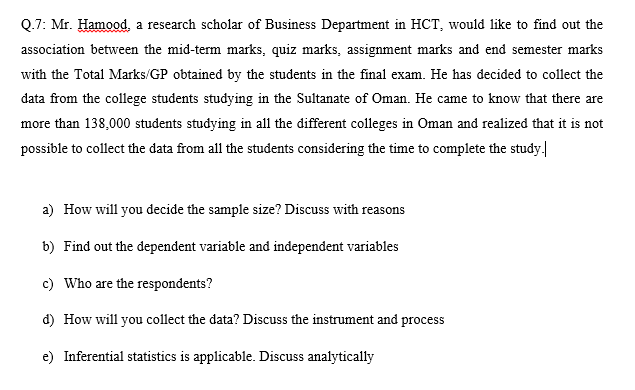
Q.7: Mr. Hamood. a research scholar of Business Department in HCT, would like to find out the association between the mid-term marks, quiz marks, assignment marks and end semester marks with the Total Marks/GP obtained by the students in the final exam. He has decided to collect the data from the college students studying in the Sultanate of Oman. He came to know that there are more than 138,000 stuđents studying in all the different colleges in Oman and realized that it is not possible to collect the data from all the students considering the time to complete the study a) How will you decide the sample size? Discuss with reasons b) Find out the dependent variable and independent variables c) Who are the respondents?
Q.7: Mr. Hamood. a research scholar of Business Department in HCT, would like to find out the association between the mid-term marks, quiz marks, assignment marks and end semester marks with the Total Marks/GP obtained by the students in the final exam. He has decided to collect the data from the college students studying in the Sultanate of Oman. He came to know that there are more than 138,000 stuđents studying in all the different colleges in Oman and realized that it is not possible to collect the data from all the students considering the time to complete the study a) How will you decide the sample size? Discuss with reasons b) Find out the dependent variable and independent variables c) Who are the respondents?

Trigonometry (MindTap Course List)
8th Edition
ISBN:9781305652224
Author:Charles P. McKeague, Mark D. Turner
Publisher:Charles P. McKeague, Mark D. Turner
Chapter8: Complex Numbers And Polarcoordinates
Section: Chapter Questions
Problem 2RP: A Bitter Dispute With the publication of Ars Magna, a dispute intensified between Jerome Cardan and...

Related questions

Concept explainers
Contingency Table
A contingency table can be defined as the visual representation of the relationship between two or more categorical variables that can be evaluated and registered. It is a categorical version of the scatterplot, which is used to investigate the linear relationship between two variables. A contingency table is indeed a type of frequency distribution table that displays two variables at the same time.
Binomial Distribution
Binomial is an algebraic expression of the sum or the difference of two terms. Before knowing about binomial distribution, we must know about the binomial theorem.
Topic Video
Question
Transcribed Image Text:Q.7: Mr. Hamood. a research scholar of Business Department in HCT, would like to find out the
association between the mid-term marks, quiz marks, assignment marks and end semester marks
with the Total Marks/GP obtained by the students in the final exam. He has decided to collect the
data from the college students studying in the Sultanate of Oman. He came to know that there are
more than 138,000 stuđents studying in all the different colleges in Oman and realized that it is not
possible to collect the data from all the students considering the time to complete the study
a) How will you decide the sample size? Discuss with reasons
b) Find out the dependent variable and independent variables
c) Who are the respondents?
Expert Solution
This question has been solved!
Explore an expertly crafted, step-by-step solution for a thorough understanding of key concepts.

Step by step
Solved in 2 steps

Knowledge Booster


Learn more about
Need a deep-dive on the concept behind this application? Look no further. Learn more about this topic, statistics and related others by exploring similar questions and additional content below.Recommended textbooks for you
Trigonometry (MindTap Course List)
Trigonometry
ISBN:
9781305652224
Author:
Charles P. McKeague, Mark D. Turner
Publisher:
Cengage Learning

Holt Mcdougal Larson Pre-algebra: Student Edition…
Algebra
ISBN:
9780547587776
Author:
HOLT MCDOUGAL
Publisher:
HOLT MCDOUGAL

Elements Of Modern Algebra
Algebra
ISBN:
9781285463230
Author:
Gilbert, Linda, Jimmie
Publisher:
Cengage Learning,
Trigonometry (MindTap Course List)
Trigonometry
ISBN:
9781305652224
Author:
Charles P. McKeague, Mark D. Turner
Publisher:
Cengage Learning
Holt Mcdougal Larson Pre-algebra: Student Edition…
Algebra
ISBN:
9780547587776
Author:
HOLT MCDOUGAL
Publisher:
HOLT MCDOUGAL
Elements Of Modern Algebra
Algebra
ISBN:
9781285463230
Author:
Gilbert, Linda, Jimmie
Publisher:
Cengage Learning,

Algebra & Trigonometry with Analytic Geometry
Algebra
ISBN:
9781133382119
Author:
Swokowski
Publisher:
Cengage