
Micro Economics For Today
10th Edition
ISBN:9781337613064
Author:Tucker, Irvin B.
Publisher:Tucker, Irvin B.
Chapter11: Labor Markets
Section: Chapter Questions
Problem 2SQP

Related questions
Question
Transcribed Image Text:Q3. Demand is given by (P+ 10)(Q + 20) = 1000 and supply by
Q – 4P+ 10 = 0. Determine the equilibrium, show it graphi-
cally as accurately as possible and determine the consumer sur-
plus (round up to the nearest integer). How will this surplus be
affected if price increases by 2 and the equilibrium is not realized?
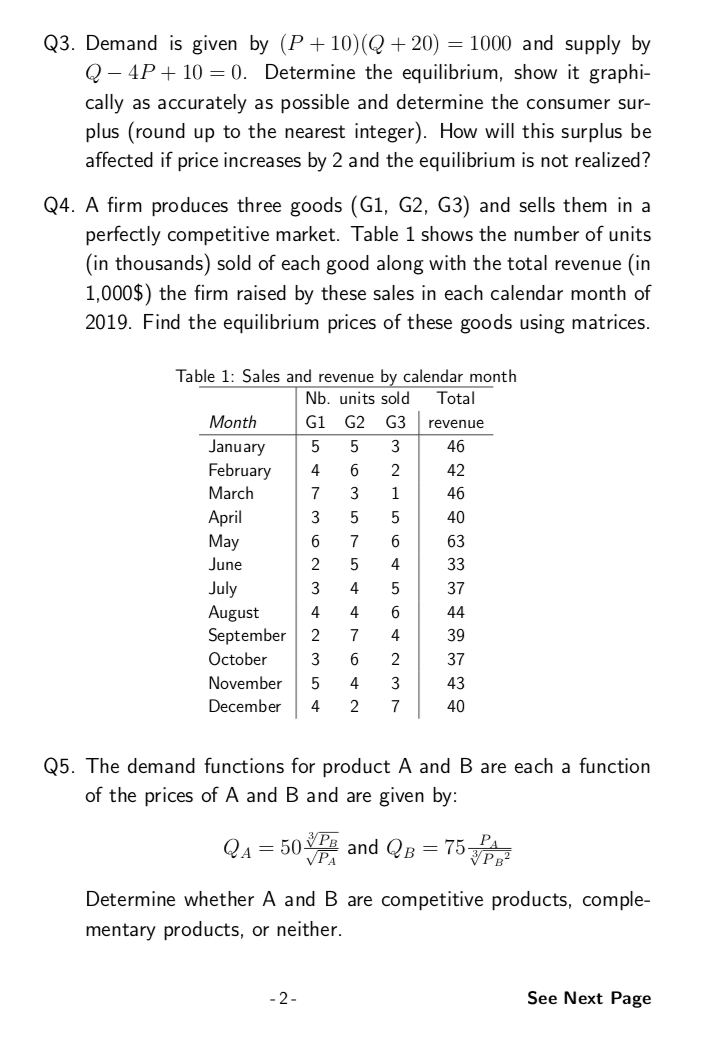
Q4. A firm produces three goods (G1, G2, G3) and sells them in a
perfectly competitive market. Table 1 shows the number of units
(in thousands) sold of each good along with the total revenue (in
1,000$) the firm raised by these sales in each calendar month of
2019. Find the equilibrium prices of these goods using matrices.
Table 1: Sales and revenue by calendar month
Nb. units sold
Total
Month
G1 G2 G3
revenue
January
February
March
3
46
6.
2
42
7
3
1
46
April
May
3
40
7
63
June
2
4
33
July
August
September
4
37
4
4
44
2
7
4
39
October
3
2
37
November
4
3
43
December
4
2
7
40
Q5. The demand functions for product A and B are each a function
of the prices of A and B and are given by:
QA = 50 and QB = 75
VPA
Determine whether A and B are competitive products, comple-
mentary products, or neither.
- 2-
See Next Page
Transcribed Image Text:Q1. A sole producer has a marginal revenue function given by:
dTR
= 100 – 3Q?
dQ
Is demand elastic or inelastic if they produce 5 units?
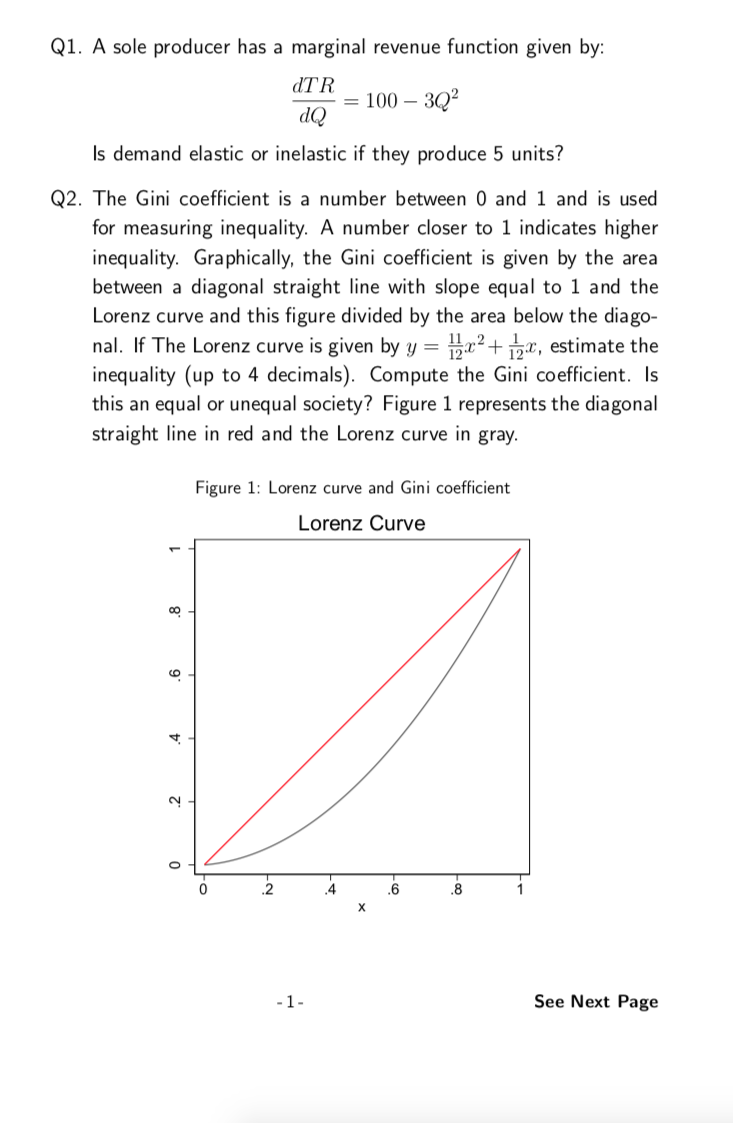
Q2. The Gini coefficient is a number between 0 and 1 and is used
for measuring inequality. A number closer to 1 indicates higher
inequality. Graphically, the Gini coefficient is given by the area
between a diagonal straight line with slope equal to 1 and the
Lorenz curve and this figure divided by the area below the diago-
nal. If The Lorenz curve is given by y = pa²+ px, estimate the
inequality (up to 4 decimals). Compute the Gini coefficient. Is
this an equal or unequal society? Figure 1 represents the diagonal
straight line in red and the Lorenz curve in gray.
Figure 1: Lorenz curve and Gini coefficient
Lorenz Curve
2
4
.6
8
-1-
See Next Page
Expert Solution
This question has been solved!
Explore an expertly crafted, step-by-step solution for a thorough understanding of key concepts.

Step by step
Solved in 2 steps with 2 images

Knowledge Booster


Learn more about
Need a deep-dive on the concept behind this application? Look no further. Learn more about this topic, economics and related others by exploring similar questions and additional content below.Recommended textbooks for you


