Q11. Which of the following is TRUE based on the output below? F test to compare two variances data: Length by Lathe F = 0.064616, num df 49, denom df = 49, p-value < 2.2e-16 alternative hypothesis: true ratio of variances is not equal to 1 95 percent confidence interval: 0.03666794 0.11386527 sample estimates: ratio of variances 0.06461583 O There is sufficient evidence to say that the variances of the lengths of parts produced by lathe brand A and lathe brand B are different O There is no sufficient evidence to say that the variances of the lengths of parts produced by lathe brand A and lathe brand B are different O There is sufficient evidence to say that the mean length of parts produced by lathe brand A and lathe brand B are different There is no sufficient evidence to say that the mean length of parts produced by lathe brand A and lathe brand B are different Q12. Which of the following will lead to the narrowing of the width of a confidence interval in estimating the population mean? 1. decreasing the sample size II. Increasing the level of confidence OI only Oll only O Both I and II ONeither I nor II
Q11. Which of the following is TRUE based on the output below? F test to compare two variances data: Length by Lathe F = 0.064616, num df 49, denom df = 49, p-value < 2.2e-16 alternative hypothesis: true ratio of variances is not equal to 1 95 percent confidence interval: 0.03666794 0.11386527 sample estimates: ratio of variances 0.06461583 O There is sufficient evidence to say that the variances of the lengths of parts produced by lathe brand A and lathe brand B are different O There is no sufficient evidence to say that the variances of the lengths of parts produced by lathe brand A and lathe brand B are different O There is sufficient evidence to say that the mean length of parts produced by lathe brand A and lathe brand B are different There is no sufficient evidence to say that the mean length of parts produced by lathe brand A and lathe brand B are different Q12. Which of the following will lead to the narrowing of the width of a confidence interval in estimating the population mean? 1. decreasing the sample size II. Increasing the level of confidence OI only Oll only O Both I and II ONeither I nor II

MATLAB: An Introduction with Applications
6th Edition
ISBN:9781119256830
Author:Amos Gilat
Publisher:Amos Gilat
Chapter1: Starting With Matlab
Section: Chapter Questions
Problem 1P

Related questions
Question
Kindly answer the following questions: (use 5% level of significance if needed)
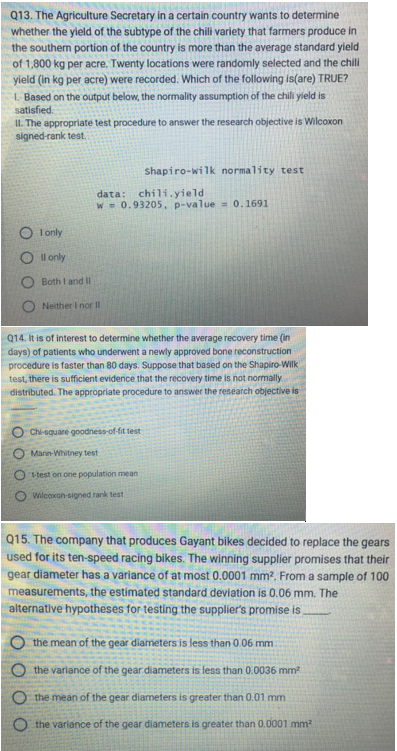
Transcribed Image Text:Q13. The Agriculture Secretary in a certain country wants to determine
whether the yield of the subtype of the chili variety that farmers produce in
the southern portion of the country is more than the average standard yield
of 1,800 kg per acre. Twenty locations were randomly selected and the chili
yield (in kg per acre) were recorded. Which of the following is(are) TRUE?
1. Based on the output below, the normality assumption of the chili yield is
satisfied.
II. The appropriate test procedure to answer the research objective is Wilcoxon
signed-rank test.
OI only
Oll only
Both I and II
0 0 0 0
data: chili.yield
w 0.93205, p-value = 0.1691
Neither I nor II
shapiro-wilk normality test
Q14. It is of interest to determine whether the average recovery time (in
days) of patients who underwent a newly approved bone reconstruction
procedure is faster than 80 days. Suppose that based on the Shapiro-Wilk
test, there is sufficient evidence that the recovery time is not normally
distributed. The appropriate procedure to answer the research objective is
O Chi-square goodness-of-fit test
Mann-Whitney test.
1-test on one population meani
Wilcoxon-signed rank test
Q15. The company that produces Gayant bikes decided to replace the gears
used for its ten-speed racing bikes. The winning supplier promises that their
gear diameter has a variance of at most 0.0001 mm². From a sample of 100
measurements, the estimated standard deviation is 0.06 mm. The
alternative hypotheses for testing the supplier's promise is.
the mean of the gear diameters is less than 0.06 mm
O the variance of the gear diameters is less than 0.0036 mm²
the mean of the gear diameters is greater than 0.01 mm
the variance of the gear diameters is greater than 0.0001 mm²
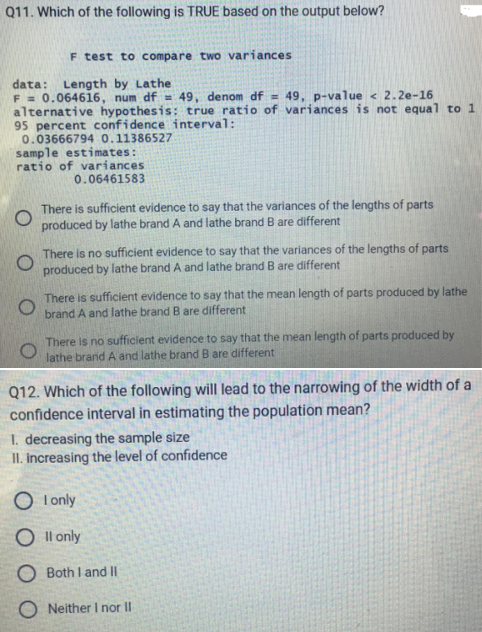
Transcribed Image Text:Q11. Which of the following is TRUE based on the output below?
F test to compare two variances
data: Length by Lathe
F = 0.064616, num df 49, denom df = 49, p-value < 2.2e-16
alternative hypothesis: true ratio of variances is not equal to 1
95 percent confidence interval:
0.03666794 0.11386527
sample estimates:
ratio of variances
0.06461583
O
There is sufficient evidence to say that the variances of the lengths of parts
produced by lathe brand A and lathe brand B are different
O
There is no sufficient evidence to say that the variances of the lengths of parts
produced by lathe brand A and lathe brand B are different
O
There is sufficient evidence to say that the mean length of parts produced by lathe
brand A and lathe brand B are different
There is no sufficient evidence to say that the mean length of parts produced by
lathe brand A and lathe brand B are different
Q12. Which of the following will lead to the narrowing of the width of a
confidence interval in estimating the population mean?
1. decreasing the sample size
II. Increasing the level of confidence
OI only
Oll only
O Both I and II
ONeither I nor II
Expert Solution
This question has been solved!
Explore an expertly crafted, step-by-step solution for a thorough understanding of key concepts.

Step by step
Solved in 4 steps

Recommended textbooks for you
MATLAB: An Introduction with Applications
Statistics
ISBN:
9781119256830
Author:
Amos Gilat
Publisher:
John Wiley & Sons Inc

Probability and Statistics for Engineering and th…
Statistics
ISBN:
9781305251809
Author:
Jay L. Devore
Publisher:
Cengage Learning

Statistics for The Behavioral Sciences (MindTap C…
Statistics
ISBN:
9781305504912
Author:
Frederick J Gravetter, Larry B. Wallnau
Publisher:
Cengage Learning
MATLAB: An Introduction with Applications
Statistics
ISBN:
9781119256830
Author:
Amos Gilat
Publisher:
John Wiley & Sons Inc
Probability and Statistics for Engineering and th…
Statistics
ISBN:
9781305251809
Author:
Jay L. Devore
Publisher:
Cengage Learning
Statistics for The Behavioral Sciences (MindTap C…
Statistics
ISBN:
9781305504912
Author:
Frederick J Gravetter, Larry B. Wallnau
Publisher:
Cengage Learning

Elementary Statistics: Picturing the World (7th E…
Statistics
ISBN:
9780134683416
Author:
Ron Larson, Betsy Farber
Publisher:
PEARSON

The Basic Practice of Statistics
Statistics
ISBN:
9781319042578
Author:
David S. Moore, William I. Notz, Michael A. Fligner
Publisher:
W. H. Freeman

Introduction to the Practice of Statistics
Statistics
ISBN:
9781319013387
Author:
David S. Moore, George P. McCabe, Bruce A. Craig
Publisher:
W. H. Freeman