Q2: If P(A) = 0.25, P (B) = 0.45, P (ACNBC) = 0.43, draw the Venn diagrams and determine the following probabilities: 1. P(ANB); 2. P(ACUBC); 3.P(ANB); 4.P(AUB); 5.P(ANB).
Q2: If P(A) = 0.25, P (B) = 0.45, P (ACNBC) = 0.43, draw the Venn diagrams and determine the following probabilities: 1. P(ANB); 2. P(ACUBC); 3.P(ANB); 4.P(AUB); 5.P(ANB).

Chapter8: Sequences, Series,and Probability
Section8.7: Probability
Problem 11ECP: A manufacturer has determined that a machine averages one faulty unit for every 500 it produces....

Related questions
Question
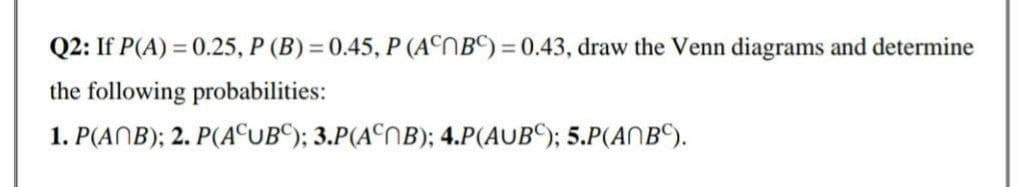
Transcribed Image Text:Q2: If P(A) = 0.25, P (B) = 0.45, P (ACNBC) = 0.43, draw the Venn diagrams and determine
the following probabilities:
1. P(ANB); 2. P(AUB); 3.P(ANB); 4.P(AUB); 5.P(ANBC).
Expert Solution
This question has been solved!
Explore an expertly crafted, step-by-step solution for a thorough understanding of key concepts.

Step by step
Solved in 4 steps with 3 images

Recommended textbooks for you