(Statistical Anaylsis) For the following graph, explain the reason for every statistic that is calculated. For example, You have a scatter plot of an hourly wages vs level of education, the trend is represented by a cubic curve with R^2=0.999. It can mean that the relationship of the level of education vs the hourly wages has a cubic trend as the cubic model suits well the set of data (R^2 is very close to 1).
(Statistical Anaylsis) For the following graph, explain the reason for every statistic that is calculated. For example, You have a scatter plot of an hourly wages vs level of education, the trend is represented by a cubic curve with R^2=0.999. It can mean that the relationship of the level of education vs the hourly wages has a cubic trend as the cubic model suits well the set of data (R^2 is very close to 1).

Chapter9: Sequences, Probability And Counting Theory
Section9.5: Counting Principles
Problem 4SE: Answer the following questions. 4. Describe how the permutation of ii objects differs from the...

Related questions
Question
(Statistical Anaylsis)
For the following graph, explain the reason for every statistic that is calculated.
For example, You have a
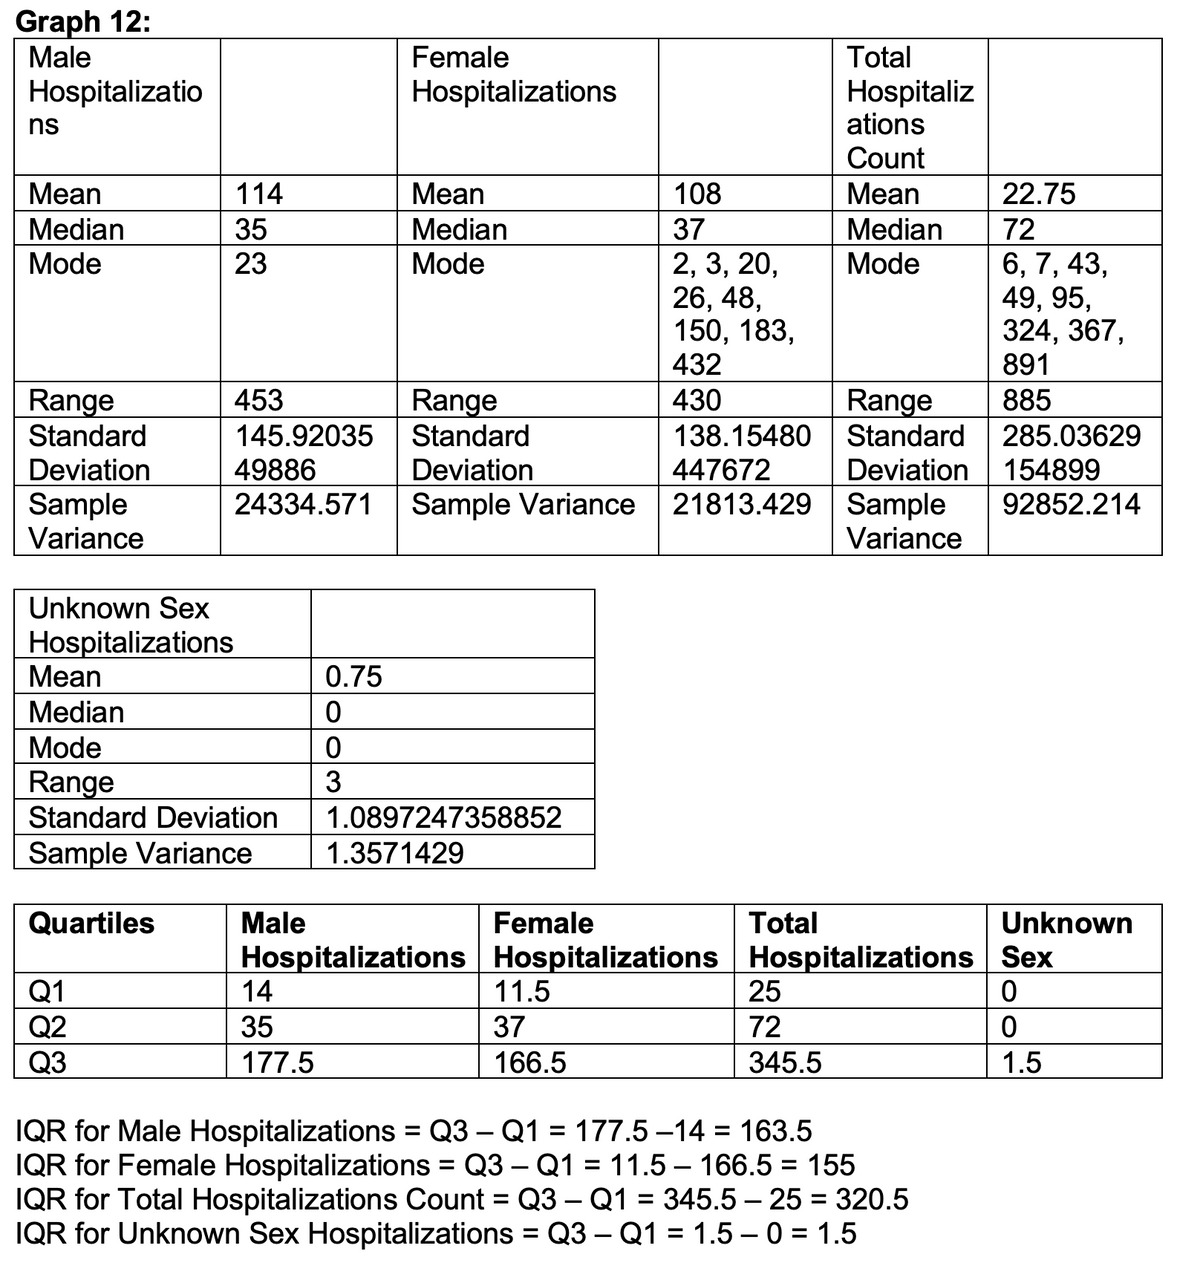
Transcribed Image Text:Graph 12:
Male
Female
Total
Hospitaliz
Hospitalizatio
Hospitalizations
ns
ations
Count
Mean
114
Mean
108
Mean
Median
35
Median
37
Median
Mode
23
Mode
2, 3, 20,
Mode
26, 48,
150, 183,
432
453
430
Range
Range
Standard
Range
Standard
145.92035
138.15480 Standard
Deviation
49886
Deviation
447672
Sample
24334.571 Sample Variance
21813.429 Sample
Variance
Variance
Unknown Sex
Hospitalizations
Mean
0.75
Median
0
Mode
0
Range
3
1.0897247358852
Standard Deviation
Sample Variance
1.3571429
Quartiles
Male
Female
Hospitalizations
Total
Hospitalizations
Hospitalizations
Q1
14
11.5
25
Q2
35
37
72
Q3
177.5
166.5
345.5
IQR for Male Hospitalizations = Q3 Q1 = 177.5 -14=163.5
IQR for Female Hospitalizations = Q3 Q1 = 11.5 166.5 = 155
IQR for Total Hospitalizations Count = Q3 Q1 = 345.5-25 = 320.5
IQR for Unknown Sex Hospitalizations = Q3 Q1 = 1.5-0 = 1.5
22.75
72
6, 7, 43,
49, 95,
324, 367,
891
885
285.03629
154899
92852.214
Unknown
Sex
0
0
1.5
Deviation 15
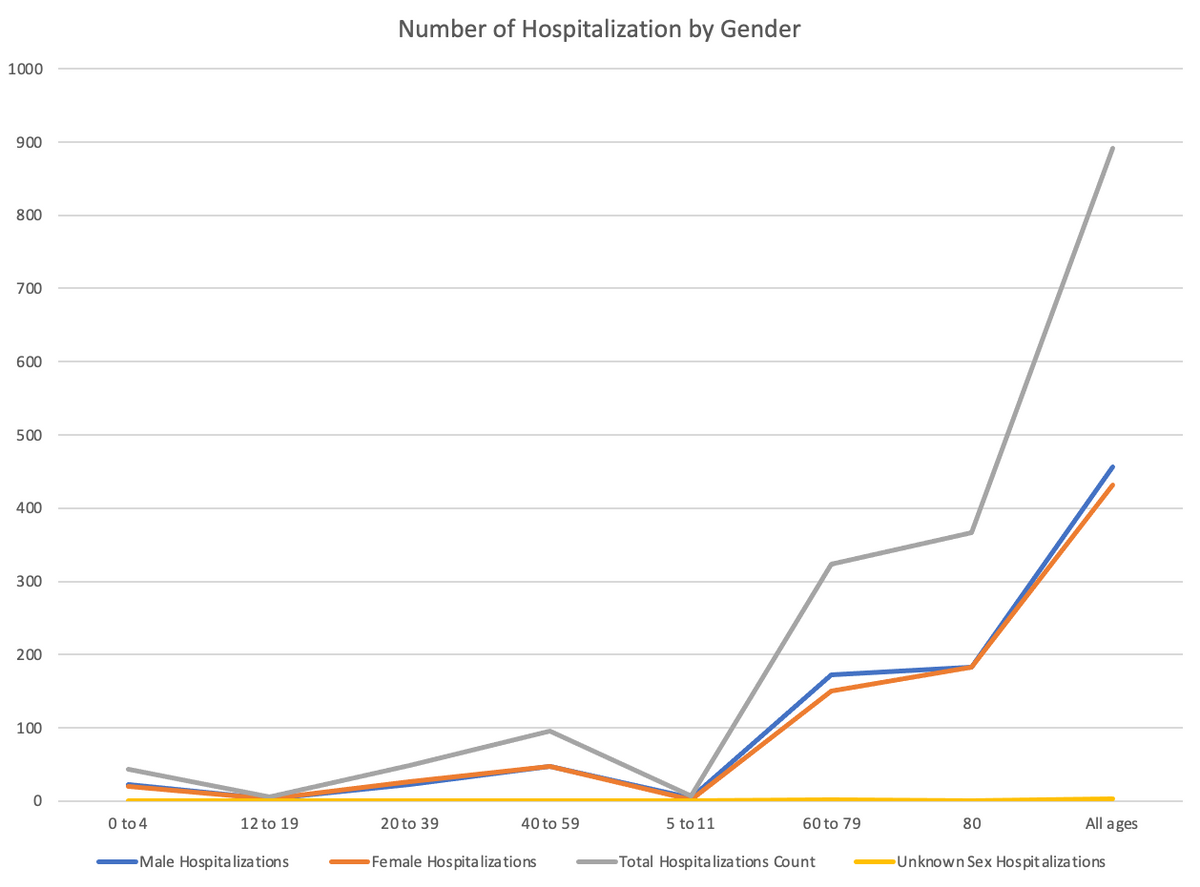
Transcribed Image Text:1000
900
800
700
600
500
400
300
200
100
0
12 to 19
Male Hospitalizations
0 to 4
Number of Hospitalization by Gender
20 to 39
40 to 59
5 to 11
Female Hospitalizations
Total Hospitalizations Count
60 to 79
All ages
80
Unknown Sex Hospitalizations
Expert Solution
This question has been solved!
Explore an expertly crafted, step-by-step solution for a thorough understanding of key concepts.

Step by step
Solved in 5 steps

Recommended textbooks for you

Algebra & Trigonometry with Analytic Geometry
Algebra
ISBN:
9781133382119
Author:
Swokowski
Publisher:
Cengage

College Algebra (MindTap Course List)
Algebra
ISBN:
9781305652231
Author:
R. David Gustafson, Jeff Hughes
Publisher:
Cengage Learning
Algebra & Trigonometry with Analytic Geometry
Algebra
ISBN:
9781133382119
Author:
Swokowski
Publisher:
Cengage
College Algebra (MindTap Course List)
Algebra
ISBN:
9781305652231
Author:
R. David Gustafson, Jeff Hughes
Publisher:
Cengage Learning

Algebra and Trigonometry (MindTap Course List)
Algebra
ISBN:
9781305071742
Author:
James Stewart, Lothar Redlin, Saleem Watson
Publisher:
Cengage Learning