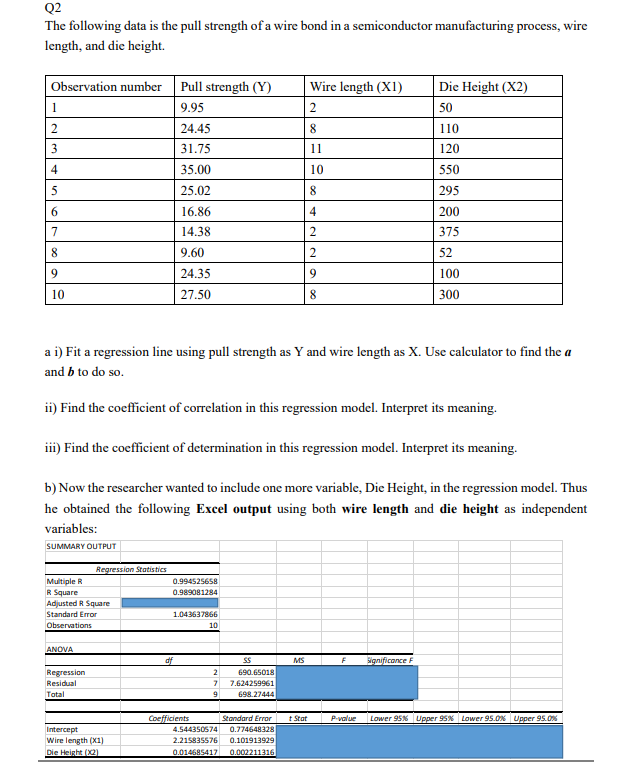
Q2 The following data is the pull strength of a wire bond in a semiconductor manufacturing process, wire length, and die height. Observation number Pull strength (Y) Wire length (X1) Die Height (X2) 1 9.95 2 50 24.45 110 3 31.75 11 120 4 35.00 10 550 5 25.02 295 6. 16.86 4 200 7 14. 375 8. 9.60 52 24.35 9. 100 10 27.50 8 300 a i) Fit a regression line using pull strength as Y and wire length as X. Use calculator to find the a and b to do so. ii) Find the coefficient of correlation in this regression model. Interpret its meaning. iii) Find the coefficient of determination in this regression model. Interpret its meaning. b) Now the rescarcher wanted to include one more variable, Die Height, in the regression model. Thus he obtaincd the following Excel output using both wire length and die height as independent variables: SUMMARY OUTPUT Regression Statistics Multiple R R Square Adjusted R Square 0.994525658 0.989081284 Standard Error 1.043637866 Observations 10 ANOVA of MS Significonce F Regression 2 690.65018 Residual 7.624259961 Total 698.27444 Coefficients Standard Error t Stat P-value Lower 95% Upper 95% Lower 95.0% Upper 95.0% Intercept 4.544350574 0.774648328 Wire length (X1) 2.215835576 0.101913929 Die Height (XQ) 0.014685417 0.002211316
Q2 The following data is the pull strength of a wire bond in a semiconductor manufacturing process, wire length, and die height. Observation number Pull strength (Y) Wire length (X1) Die Height (X2) 1 9.95 2 50 24.45 110 3 31.75 11 120 4 35.00 10 550 5 25.02 295 6. 16.86 4 200 7 14. 375 8. 9.60 52 24.35 9. 100 10 27.50 8 300 a i) Fit a regression line using pull strength as Y and wire length as X. Use calculator to find the a and b to do so. ii) Find the coefficient of correlation in this regression model. Interpret its meaning. iii) Find the coefficient of determination in this regression model. Interpret its meaning. b) Now the rescarcher wanted to include one more variable, Die Height, in the regression model. Thus he obtaincd the following Excel output using both wire length and die height as independent variables: SUMMARY OUTPUT Regression Statistics Multiple R R Square Adjusted R Square 0.994525658 0.989081284 Standard Error 1.043637866 Observations 10 ANOVA of MS Significonce F Regression 2 690.65018 Residual 7.624259961 Total 698.27444 Coefficients Standard Error t Stat P-value Lower 95% Upper 95% Lower 95.0% Upper 95.0% Intercept 4.544350574 0.774648328 Wire length (X1) 2.215835576 0.101913929 Die Height (XQ) 0.014685417 0.002211316

Algebra & Trigonometry with Analytic Geometry
13th Edition
ISBN:9781133382119
Author:Swokowski
Publisher:Swokowski
Chapter7: Analytic Trigonometry
Section7.6: The Inverse Trigonometric Functions
Problem 91E

Related questions
Question
Transcribed Image Text:Q2
The following data is the pull strength of a wire bond in a semiconductor manufacturing process,
wire
length, and die height.
Observation number
Pull strength (Y)
Wire length (X1)
Die Height (X2)
1
9.95
2
50
24.45
110
3
31.75
11
120
4
35.00
10
550
5
25.02
295
6.
16.86
4
200
7
14.
375
8.
9.60
52
24.35
9.
100
10
27.50
8
300
a i) Fit a regression line using pull strength as Y and wire length as X. Use calculator to find the a
and b to do so.
ii) Find the coefficient of correlation in this regression model. Interpret its meaning.
iii) Find the coefficient of determination in this regression model. Interpret its meaning.
b) Now the rescarcher wanted to include one more variable, Die Height, in the regression model. Thus
he obtaincd the following Excel output using both wire length and die height as independent
variables:
SUMMARY OUTPUT
Regression Statistics
Multiple R
R Square
Adjusted R Square
0.994525658
0.989081284
Standard Error
1.043637866
Observations
10
ANOVA
of
MS
Significonce F
Regression
2
690.65018
Residual
7.624259961
Total
698.27444
Coefficients
Standard Error
t Stat
P-value
Lower 95% Upper 95% Lower 95.0% Upper 95.0%
Intercept
4.544350574
0.774648328
Wire length (X1)
2.215835576
0.101913929
Die Height (XQ)
0.014685417
0.002211316
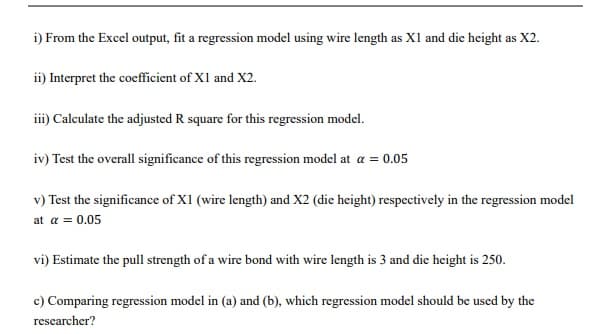
Transcribed Image Text:i) From the Excel output, fit a regression model using wire length as X1 and die height as X2.
ii) Interpret the coefficient of X1 and X2.
iii) Calculate the adjusted R square for this regression model.
iv) Test the overall significance of this regression model at a = 0.05
v) Test the significance of XI (wire length) and X2 (die height) respectively in the regression model
at a = 0.05
vi) Estimate the pull strength of a wire bond with wire length is 3 and die height is 250.
c) Comparing regression model in (a) and (b), which regression model should be used by the
researcher?
Expert Solution
This question has been solved!
Explore an expertly crafted, step-by-step solution for a thorough understanding of key concepts.

This is a popular solution!

Trending now
This is a popular solution!

Step by step
Solved in 3 steps with 3 images

Recommended textbooks for you
Algebra & Trigonometry with Analytic Geometry
Algebra
ISBN:
9781133382119
Author:
Swokowski
Publisher:
Cengage


Trigonometry (MindTap Course List)
Trigonometry
ISBN:
9781337278461
Author:
Ron Larson
Publisher:
Cengage Learning
Algebra & Trigonometry with Analytic Geometry
Algebra
ISBN:
9781133382119
Author:
Swokowski
Publisher:
Cengage
Trigonometry (MindTap Course List)
Trigonometry
ISBN:
9781337278461
Author:
Ron Larson
Publisher:
Cengage Learning

Functions and Change: A Modeling Approach to Coll…
Algebra
ISBN:
9781337111348
Author:
Bruce Crauder, Benny Evans, Alan Noell
Publisher:
Cengage Learning