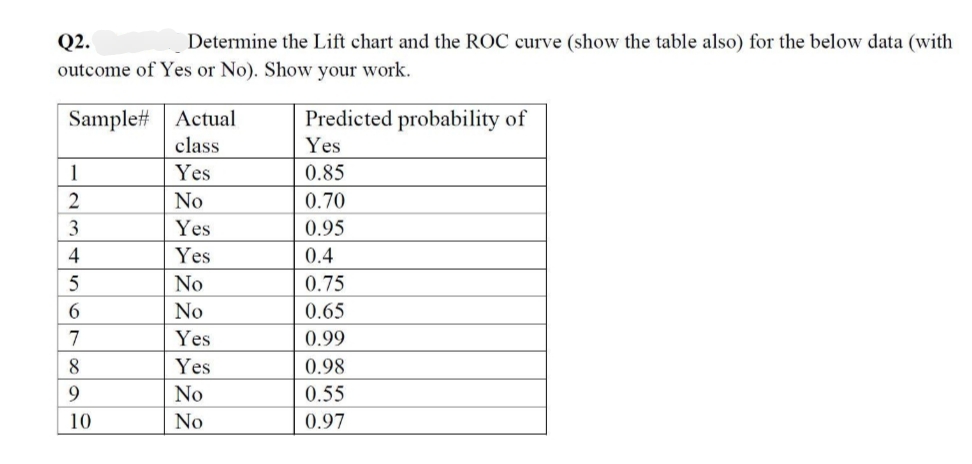
Q2. Determine the Lift chart and the ROC curve (show the table also) for the below data (with outcome of Yes or No). Show your work. Sample# Actual Predicted probability of class Yes 1 Yes 0.85 2 No 0.70 Yes 0.95 Yes 0.4 No 0.75 No 0.65 Yes 0.99 Yes 0.98 No 0.55 No 0.97 23 3 45 4 6 7 8 9 10
Q2. Determine the Lift chart and the ROC curve (show the table also) for the below data (with outcome of Yes or No). Show your work. Sample# Actual Predicted probability of class Yes 1 Yes 0.85 2 No 0.70 Yes 0.95 Yes 0.4 No 0.75 No 0.65 Yes 0.99 Yes 0.98 No 0.55 No 0.97 23 3 45 4 6 7 8 9 10

Glencoe Algebra 1, Student Edition, 9780079039897, 0079039898, 2018
18th Edition
ISBN:9780079039897
Author:Carter
Publisher:Carter
Chapter10: Statistics
Section10.4: Distributions Of Data
Problem 19PFA

Related questions
Question
6
Transcribed Image Text:Q2.
Determine the Lift chart and the ROC curve (show the table also) for the below data (with
outcome of Yes or No). Show your work.
Sample#
Predicted probability of
Actual
class
Yes
1
Yes
0.85
2
No
0.70
3
Yes
0.95
4
Yes
0.4
5
No
0.75
6
No
0.65
7
Yes
0.99
8
Yes
0.98
9
No
0.55
No
0.97
10
Expert Solution
This question has been solved!
Explore an expertly crafted, step-by-step solution for a thorough understanding of key concepts.

Step by step
Solved in 3 steps with 7 images

Recommended textbooks for you
Glencoe Algebra 1, Student Edition, 9780079039897…
Algebra
ISBN:
9780079039897
Author:
Carter
Publisher:
McGraw Hill
Glencoe Algebra 1, Student Edition, 9780079039897…
Algebra
ISBN:
9780079039897
Author:
Carter
Publisher:
McGraw Hill