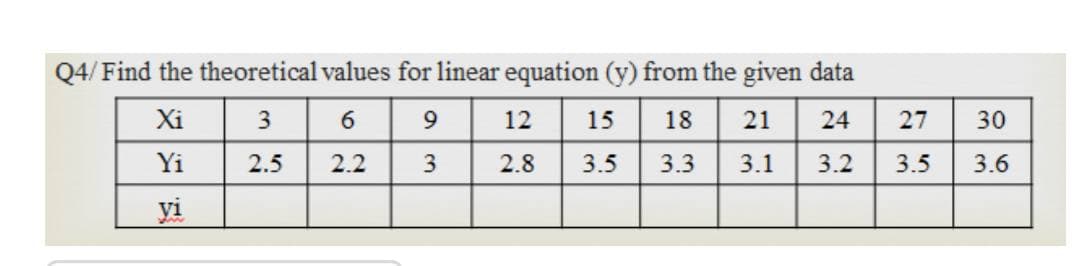
Q4/ Find the theoretical values for linear equation (y) from the given data Xi 3 6. 9 12 15 18 21 24 27 30 Yi 2.5 2.2 3 2.8 3.5 3.3 3.1 3.2 3.5 3.6 yi


Q: Let X be the number of anomalies that occur in the material of a particular region of an aircraft…
A: Solution: Let X represent the number of anomalies that occur in the material of a particular region…
Q: In a study of a new method of teaching arithmetic, claimed to improve on conventional techniques,…
A: Assume that the variance of scores for Group A (1st population) is σ12 and the variance of scores…
Q: using your z-score tables, find the area under the curve to the left of z=0.40
A: We want to find find the area under the curve to the left of z=0.40 I.e. P(z<0.40) Where,…
Q: Find the mean, ?, and standard deviation, ?, for a binomial random variable X. (Round all answers…
A:
Q: Do these data show sufficient evidence to reject the claim that the choice of college major is…
A: here given , contingency table of choice of college major and hand posture here use chi -square…
Q: In a test of the effectiveness of garlic for lowering cholesterol, 49 subjects were treated with raw…
A:
Q: How did you get the 100/12 value? Can you show the full work for that
A:
Q: You must estimate the mean temperature (in degrees Fahrenheit) with the following sample…
A:
Q: ONLY ILLUSTRATE THE DISTRIBUTION OF MEAN. DO THIS TYPEWRITTEN FOR UPVOTE, NO UPVOTE FOR HANDWRITTEN.…
A: Let z be the standard normally distributed random variable with mean 0 and standard deviation 1
Q: Over the past few decades, public health officials have examined the link between weight concerns…
A: From the provided information, Sample size (n) = 273 From which 63 said they smoked to stay thin.
Q: (a) State the null hypothesis H, and the alternative hypothesis H,. p H, :0 (b) Determine the type…
A:
Q: 2) What sets linear functions apart from all other equations and graphs is that the average rate of…
A: The objective is to interpret the AROC and slope of a linear function.
Q: The table below shows the weight (in kilograms) of 30 randomly selected PBA players for the current…
A:
Q: Match each of the hypothesis test conclusions below to the corresponding p-value.…
A: To decide on the hypothesis testing we compare the p-value with the level of significance.…
Q: Which hypothesis test has the greatest power? a. r 2 = 0.9 & n = 30 b. r 2 = 0.9 & n = 300 c. r 2…
A: See the handwritten solution
Q: A continuous random variable X has probability density function fx(x) given by Sx(x) = k (2 – x )(x…
A: The continuous random variable x has the probability density function fx(x) is given by,…
Q: Explain minimum variance unbiased estimation with example. Yn be a random sample from a population…
A:
Q: 8 Find the 75th percentile. 9 What is the percentile for 61? 10 Find the 60th percentile.
A: Percentile is the measure of location. It divide the data into 100 equal parts with 99 points. It is…
Q: A manufacturer of sport shoes must control the water resistance of the product. Water resistance is…
A:
Q: A local cellular phone company wishes to estimate the proportion of Clinton County people who own a…
A: Given information: Confidence level is 95%. Significance level is 5%. From the standard normal…
Q: A study was done to look at the relationship between number of movies people watch at the theater…
A: 1. In this case, movies is the independent variable (x), and books is the dependent variable (y).
Q: Create a Venn diagram of this Problem Question: A survey of 85 students asked them about the…
A:
Q: The table presents gasoline mileage performance for 25 automobiles (Source: Motor Trend, 1975). Y X1…
A: Given Information: Consider the given data: Y X1 X2 X3 X4 X5 X6 X7 X8 X9 X10 X11 18.9 350 165…
Q: 3. The average consumption of rice that a rural male adult person in a year is 70 kilos. If 25 rural…
A: Ans# Here X ~ N( μ, σ) Where μ = 70 and σ = 112, sample size n = 25 Find…
Q: A. decile 7. The following values are the ages of 15 students in a statistics class: 18 18 19 21 21…
A:
Q: Does the source of medical information affect people’s confidence that it is true
A: Vaccinations are wont to boost your system by teaching your body the way to fight threats. such a…
Q: ) What is the probability of rejecting the lot? b) What is the probability of not finding defective…
A: here given , A microchip manufacturer controls the quality of its products by inspecting a batch of…
Q: Which one is equal to the probability of making a type I error on a hypothesis test? a. p-value b.…
A: Solution
Q: You run a fast-food restaurant and you are assessing the speed of service at your drive through…
A: Let X1, X2,...., Xn denotes the random sample of the number of cars served for each of 30 random…
Q: Do shoppers at the mall spend more money on average the day after Thanksgiving compared to the day…
A:
Q: What is the incidence of CHD in smokers that can be attributed to smoking? Use the already rounded…
A: Cohort study used to establish the disease by following over a period of time among the exposure. It…
Q: Use the model found above to answer this question. In what year will the estimated revenue of…
A: The question is about regression model Given :
Q: A random sample of 30 students had a final exam average of 86 with a standard deviation of 2 points.…
A:
Q: Which option below contains only things that match each other? Group of answer choices p>α, Obt in…
A: The objective is to identify the correct statement.
Q: You pick a ticket from a box containing 5 tickets numbered 1 to 5. What is the probability you get…
A: Solution-: We have 5 tickets numbered 1 to 5 We pick out 10 tickets with replacement. We want find,…
Q: Pressurized air is being used in a manufacturing company in its daily operation. There are three…
A: It is given that P(A)=0.41, P(A∪B)=0.97 and P(A∩Bc)=0.02.
Q: Which of the following are statistics? a. σ 2 b. s c. μD d. More than one of the above…
A: Which of the following are statistics? a. σ 2 b. s c. μD d. More than one of the above is correct…
Q: . "On the Standford-Binet test, the mean IQ is 100. A class of 7 kindergarten pupils were tested…
A:
Q: An interaction effect can be defined as the effect ______. A. that does not occur between the…
A: We have given the following statement .
Q: a. Null and alternative hypothesis. b. Level of Significance. c. Test statistic to be used and…
A: The provided information is µ¯A=0.75 µ¯B=0.65σA=0.75 σB=0.65n1=59, n2=59α=0.05 a.The null and…
Q: Let 0 denote the probability that a randomly sampled individual in some population voted…
A:
Q: The displacement in simple harmonic mo- tion is a maximum when the 1. velocity is a maximum. 2.…
A: The displacement in simple harmonic mo tion is a maximum when the ............
Q: 18. Show that for type III population -,0Sx<00, p = 0, e" Tp dp : where p is known, is a maximum…
A:
Q: Consider the following preference profile: Applicant Preferences Hospital Preferences H H2 Ha HA As…
A:
Q: Direction: Compute and Illustrate the distribution of the mean. 2. The number of hours spent playing…
A: Given,sample size(n)=42mean(μ)=10standard deviation(σ)=13
Q: medicines and novelties were Dollar 6,25,000, dollar 2,20,000, dolar 1,88,000 and dollar. 94,000…
A:
Q: Please solve using the 5 steps, thank you. Oil wells in a large field produce an average of 3.5…
A:
Q: In the recent Census, three percent of the U.S. population reported being of two or more races.…
A:
Q: Tate (ih Beats per minute) of adult males is equal to 69.2 bpm. For a random sample of 164 adult…
A:
Q: Researchers claim that “mean cooking time of two types of food products is same”. That claim…
A: test statistic- t =-3.12

Step by step
Solved in 2 steps with 2 images

- On the second sheet is data which shows the rate of growth of a particular patch of bamboo vs daily high temperature.(a) Construct a scatterplot, including the equation of the line of best fit and value of R2.(b) What would the predicted growth rate be for a day with a temperature of 84◦?(c) Is there evidence, at α = 0.01, to support a claim that there is a linear relationship between temperature and growth rate? Please state clearly the null hypothesis, the alternative hypothesis, and what decision you make.A college bookstore must order books two months before each semester starts. They believe that the number of books that will ultimately be sold for any particular course is related to the number of students registered for the course when the books are ordered. They would like to develop a linear regression equation to help plan how many books to order. From past records, the bookstore obtains the number of students registered, X, and the number of books actually sold for a course, Y, for 12 different semesters. These data are below. Show the complete table for your solutions. At a .01 level of significance is there sufficient evidence to conclude that the number of books sold is related to the number of registered students in a straight-line manner? Calculate df:Indicate whether it is a one-tail or two-tail test:Use the table for PEARSON'S CORRELATION COEFFICIENT r (Critical Values):Make a Decision by comparing critical r with the computer Pearson Correlation Coefficient:The equation of the regression line is Y^=50000+(−500)X. Where is the observed value in relation to the regression line? A financial education time of 29 hours is found to result in a amount of debt of 35500 dollars. What is the predicted amount of debt? Where is the observed value in relation to the regression line? A financial education time of 31 hours is found to result in a amount of debt of 36551 dollars. What is the predicted amount of debt? Where is the observed value in relation to the regression line? A financial education time of 22 hours is found to result in a amount of debt of 38591 dollars. What is the predicted amount of debt? Where is the observed value in relation to the regression line? dollars dollars
- A value of r close to _______ suggests at most a weak linear relationship between the variables.Obtain the general solution VARIATION OF PARAMETERSIn a study of the lung function of children, the volume of air exhaled under force in one second is called FEV1. (FEV1 stands for forced expiratory volume in one second.) Measurements were made on a group of children each year for two years. A linear model was fit to predict this year’s FEV1 as a function of last year’s FEV1 (in liters), the child’s gender (0 = Male, 1 = Female), the child’s height (in m), and the ambient atmospheric pressure (in mm). To try to improve the prediction of FEV1, additional independent variables are included in the model. These new variables are Weight (in kg), the product (interaction) of Height and Weight, and the ambient temperature (in °C). The following MINITAB output presents results of fitting the model FEV1 = β0 + β1 Last FEV1 + β2 Gender + β3 Height + β4 Weight + β5 Height · Weight + β6 Temperature + β7 Pressure + ε a) The F statistic is? b) How many degrees of freedom does the F statistic have? c) Find the P-value for the F statistic. Is the…
- A surgery intern has conducted a study of the sleeping habits of her colleagues and has developed a following regression equation: Y = 6 + 0.1X, where X is the number of hours working on one shift, and Y is the number of hours sleeping at night after that shift. Each work shift analyzed was between 8 and 24 hours long. All the following statements about the regression equation are true EXCEPT The minimum amount of sleep an intern would get is 6 hours For each hour working on a shift, interns slept an additional 0.1 hours The maximum amount of sleep an intern would get is 8.4 hours The minimum amount of sleep an intern would get is 6.8 hoursA researcher found a linear correlation between course grades and the average number of hours spent on a mobile phone each day. The line of best fit has equation y ^ = 3.7 − 0.786 x with correlation coefficient r = − 0.84. a. Does this prove that spending too much time on a phone causes students to get lower grades? b. What does the regression line predict your final grade in a course will be if you spend an average of 150 minutes per day on your phone?The least-squares regression equation is y=728.0x+14,705 where y is the median income and x is the percentage of 25 years and older with at least a bachelor's degree in the region. The scatter diagram indicates a linear relation between the two variables with a correlation coefficient of 0.8165. For every dollar increase in median income, the percent of adults having at least a bachelor's degree is ___%, on average. For a median income of $0, the percent of adults with a bachelor's degree is ____%.
- Four pairs of data yield r= 0.942 and regression equation y=3x.Also, y= 12.75. What is the best predicted value of y for x= 2.9?I need A & also the equation regression line for set of 9 points & the description Thankyou smA study was conducted to determine if a linear relationship exists between Calculus II (Y) grades and Calculus I (X). The researcher found out that the values of the slope and the y-intercept of the regression line is equal to 1.0134 and – 5.239, respectively. What is the predicted Calculus II grade when the Calculus I grade is equal to 85?