Q4) For a controlled operation on a lathe, a particular dimension of 55 + 0.25 mm. Samples of five components were each measured to the nea time intervals and the following readings obtained Sample No 2. 3. 5. 55.062 55.03 55.054 55.028 55.012 54.996 55.02 5 Range 0.26 0.17 0.14 0.21 0.26 027 0.18
Q4) For a controlled operation on a lathe, a particular dimension of 55 + 0.25 mm. Samples of five components were each measured to the nea time intervals and the following readings obtained Sample No 2. 3. 5. 55.062 55.03 55.054 55.028 55.012 54.996 55.02 5 Range 0.26 0.17 0.14 0.21 0.26 027 0.18

MATLAB: An Introduction with Applications
6th Edition
ISBN:9781119256830
Author:Amos Gilat
Publisher:Amos Gilat
Chapter1: Starting With Matlab
Section: Chapter Questions
Problem 1P

Related questions
Question
1.
Transcribed Image Text:suddenly shifis
TIONconforming. (Take o 6 s3
lo 311 psi, what would happen to the percentagr
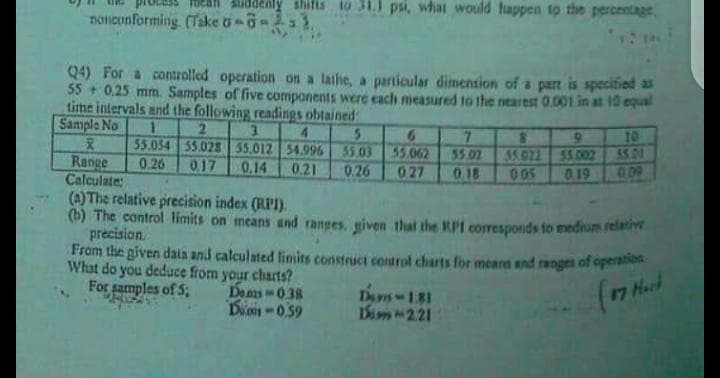
Q4) For a controlled operation on a lathe, a particular dimension of a pan is specified as
55 + 0.25 mm. Samples of five components were ecach measured to the nearest 0.001 in at 10 equal
time intervals and the following readings obtained
Sample No
5.
55.062
027
6.
55.054 55.028 55.012 54.996 55.03
0.26
10
55.01
OD9
55.02
35.022
55.002
Range
Calculate:
0.17
0.14
0.21
0.26
018
0.19
005
(a)The relative precision index (RPI).
(b) The control limits on means and ranges, given that the RPI corresponds to medium relae
precision
From the given data and calculated limits construct control charts for meard and ranges of operation
What do you deduce from your charts?
Dams 0.38
De- 0,59
For samples of 5;
Des 1.81
Sim221
/אל)
Expert Solution
This question has been solved!
Explore an expertly crafted, step-by-step solution for a thorough understanding of key concepts.

Step by step
Solved in 4 steps with 2 images

Recommended textbooks for you
MATLAB: An Introduction with Applications
Statistics
ISBN:
9781119256830
Author:
Amos Gilat
Publisher:
John Wiley & Sons Inc

Probability and Statistics for Engineering and th…
Statistics
ISBN:
9781305251809
Author:
Jay L. Devore
Publisher:
Cengage Learning

Statistics for The Behavioral Sciences (MindTap C…
Statistics
ISBN:
9781305504912
Author:
Frederick J Gravetter, Larry B. Wallnau
Publisher:
Cengage Learning
MATLAB: An Introduction with Applications
Statistics
ISBN:
9781119256830
Author:
Amos Gilat
Publisher:
John Wiley & Sons Inc
Probability and Statistics for Engineering and th…
Statistics
ISBN:
9781305251809
Author:
Jay L. Devore
Publisher:
Cengage Learning
Statistics for The Behavioral Sciences (MindTap C…
Statistics
ISBN:
9781305504912
Author:
Frederick J Gravetter, Larry B. Wallnau
Publisher:
Cengage Learning

Elementary Statistics: Picturing the World (7th E…
Statistics
ISBN:
9780134683416
Author:
Ron Larson, Betsy Farber
Publisher:
PEARSON

The Basic Practice of Statistics
Statistics
ISBN:
9781319042578
Author:
David S. Moore, William I. Notz, Michael A. Fligner
Publisher:
W. H. Freeman

Introduction to the Practice of Statistics
Statistics
ISBN:
9781319013387
Author:
David S. Moore, George P. McCabe, Bruce A. Craig
Publisher:
W. H. Freeman