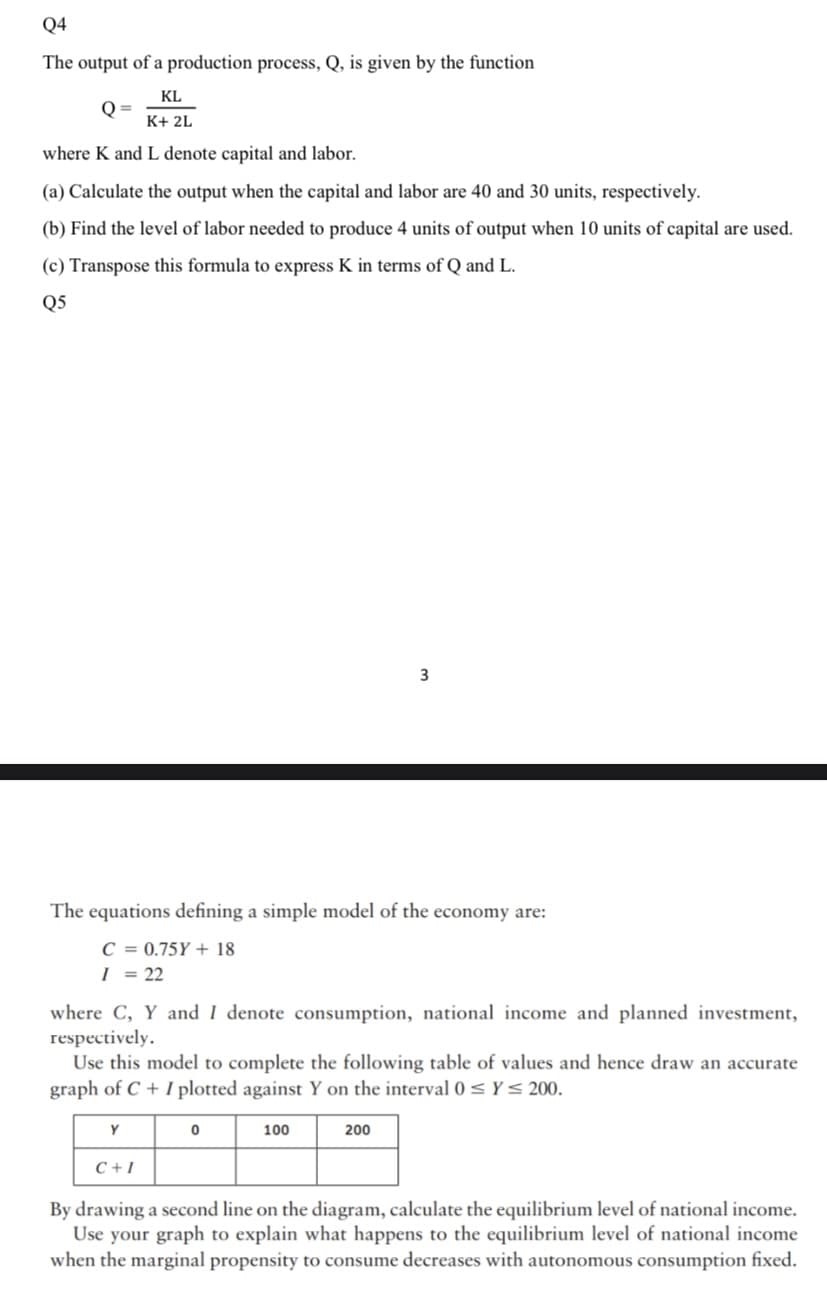
Q4 The output of a production process, Q, is given by the function KL K+ 2L where K and L denote capital and labor. (a) Calculate the output when the capital and labor are 40 and 30 units, respectively. (b) Find the level of labor needed to produce 4 units of output when 10 units of capital are used. (c) Transpose this formula to express K in terms of Q and L. 05
Q4 The output of a production process, Q, is given by the function KL K+ 2L where K and L denote capital and labor. (a) Calculate the output when the capital and labor are 40 and 30 units, respectively. (b) Find the level of labor needed to produce 4 units of output when 10 units of capital are used. (c) Transpose this formula to express K in terms of Q and L. 05
Managerial Economics: Applications, Strategies and Tactics (MindTap Course List)
14th Edition
ISBN:9781305506381
Author:James R. McGuigan, R. Charles Moyer, Frederick H.deB. Harris
Publisher:James R. McGuigan, R. Charles Moyer, Frederick H.deB. Harris
Chapter7: Production Economics
Section: Chapter Questions
Problem 8E
Related questions
Question

Transcribed Image Text:Q4
The output of a production process, Q, is given by the function
KL
Q =
K+ 2L
where K and L denote capital and labor.
(a) Calculate the output when the capital and labor are 40 and 30 units, respectively.
(b) Find the level of labor needed to produce 4 units of output when 10 units of capital are used.
(c) Transpose this formula to express K in terms of Q and L.
Q5
3
The equations defining a simple model of the economy are:
C = 0.75Y + 18
I = 22
where C, Y and I denote consumption, national income and planned investment,
respectively.
Use this model to complete the following table of values and hence draw an accurate
graph of C + I plotted against Y on the interval 0 < Y< 200.
100
200
C + I
By drawing a second line on the diagram, calculate the equilibrium level of national income.
Use your graph to explain what happens to the equilibrium level of national income
when the marginal propensity to consume decreases with autonomous consumption fixed.
Expert Solution
This question has been solved!
Explore an expertly crafted, step-by-step solution for a thorough understanding of key concepts.
Step by step
Solved in 2 steps with 1 images

Knowledge Booster
Learn more about
Need a deep-dive on the concept behind this application? Look no further. Learn more about this topic, economics and related others by exploring similar questions and additional content below.Recommended textbooks for you

Managerial Economics: Applications, Strategies an…
Economics
ISBN:
9781305506381
Author:
James R. McGuigan, R. Charles Moyer, Frederick H.deB. Harris
Publisher:
Cengage Learning


Managerial Economics: Applications, Strategies an…
Economics
ISBN:
9781305506381
Author:
James R. McGuigan, R. Charles Moyer, Frederick H.deB. Harris
Publisher:
Cengage Learning

