Q4. Explain & interpret the following table and graph respectively; Time since Time since last sale last sale Mean 884 Std. Dev. 5.977 - 70 N Valid 70 Missing Mean Median Mode Std. Deviation Skewness 8.84 8.00 5.977 .638 Std. Error of .287 Skewness Kurtosis -410 Std. Error of .566 Kurtosis Sum 619 10 15 20 25 Percentile 25 4.00 Time since last sale 50 8.00 75 13.00 Aɔuanbas
Q4. Explain & interpret the following table and graph respectively; Time since Time since last sale last sale Mean 884 Std. Dev. 5.977 - 70 N Valid 70 Missing Mean Median Mode Std. Deviation Skewness 8.84 8.00 5.977 .638 Std. Error of .287 Skewness Kurtosis -410 Std. Error of .566 Kurtosis Sum 619 10 15 20 25 Percentile 25 4.00 Time since last sale 50 8.00 75 13.00 Aɔuanbas

Glencoe Algebra 1, Student Edition, 9780079039897, 0079039898, 2018
18th Edition
ISBN:9780079039897
Author:Carter
Publisher:Carter
Chapter10: Statistics
Section10.3: Measures Of Spread
Problem 1GP

Related questions

Concept explainers
Transformation of Graphs
The word ‘transformation’ means modification. Transformation of the graph of a function is a process by which we modify or change the original graph and make a new graph.
Exponential Functions
The exponential function is a type of mathematical function which is used in real-world contexts. It helps to find out the exponential decay model or exponential growth model, in mathematical models. In this topic, we will understand descriptive rules, concepts, structures, graphs, interpreter series, work formulas, and examples of functions involving exponents.
Question
100%
Can you please explain and interpret the following table and graph.
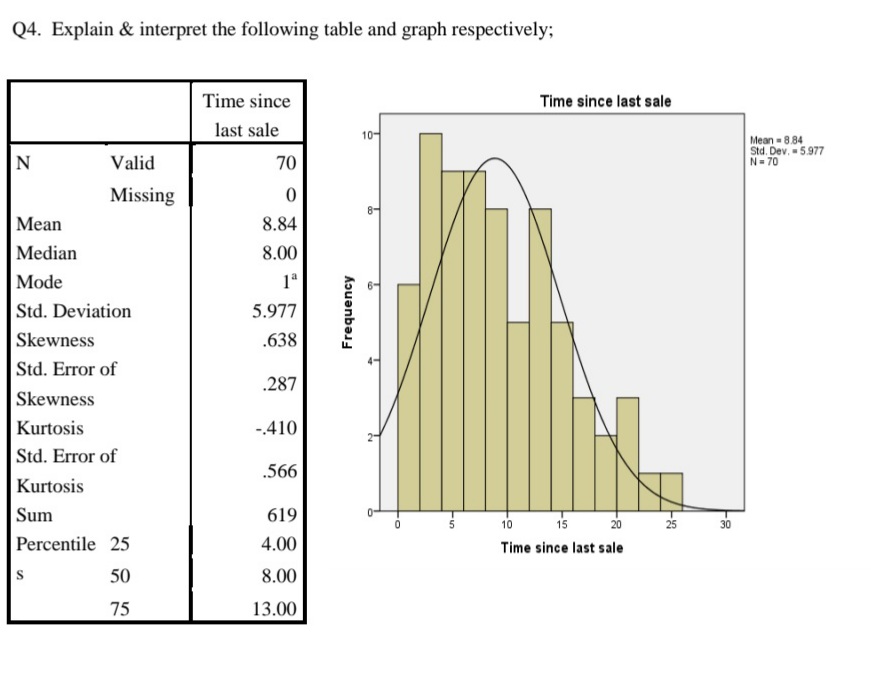
Transcribed Image Text:Q4. Explain & interpret the following table and graph respectively;
Time since
Time since last sale
last sale
10-
Mean = 8.84
Std. Dev. 5.977
N= 70
N
Valid
70
Missing
Mean
8.84
Median
8.00
Mode
Std. Deviation
5.977
Skewness
.638
Std. Error of
.287
Skewness
Kurtosis
-410
Std. Error of
.566
Kurtosis
Sum
619
10
15
20
25
30
Percentile 25
4.00
Time since last sale
50
8.00
75
13.00
Frequency
Expert Solution
This question has been solved!
Explore an expertly crafted, step-by-step solution for a thorough understanding of key concepts.

Step by step
Solved in 2 steps

Knowledge Booster


Learn more about
Need a deep-dive on the concept behind this application? Look no further. Learn more about this topic, statistics and related others by exploring similar questions and additional content below.Recommended textbooks for you
Glencoe Algebra 1, Student Edition, 9780079039897…
Algebra
ISBN:
9780079039897
Author:
Carter
Publisher:
McGraw Hill
Glencoe Algebra 1, Student Edition, 9780079039897…
Algebra
ISBN:
9780079039897
Author:
Carter
Publisher:
McGraw Hill