(Q5). The data on monthly rents, in dollars, for independent random samples of newly completed apartments in three U.S. regions are presented in the table below. Assume that the population standard deviation of the monthly rents in the three regions are equal and the populations are normally distributed. Northeast 1005 South 891 630 861 West 1025 898 1012 948 1090 1181 926 www (a). Do the data indicate that there is a difference in the monthly rent for the three regions? Discuss the assumptions you have made to carry out your analysis. Use a significance level of 10%. (b). Interpret your conclusion in words relating to the problem.
(Q5). The data on monthly rents, in dollars, for independent random samples of newly completed apartments in three U.S. regions are presented in the table below. Assume that the population standard deviation of the monthly rents in the three regions are equal and the populations are normally distributed. Northeast 1005 South 891 630 861 West 1025 898 1012 948 1090 1181 926 www (a). Do the data indicate that there is a difference in the monthly rent for the three regions? Discuss the assumptions you have made to carry out your analysis. Use a significance level of 10%. (b). Interpret your conclusion in words relating to the problem.

Glencoe Algebra 1, Student Edition, 9780079039897, 0079039898, 2018
18th Edition
ISBN:9780079039897
Author:Carter
Publisher:Carter
Chapter10: Statistics
Section10.4: Distributions Of Data
Problem 19PFA

Related questions
Topic Video
Question
100%
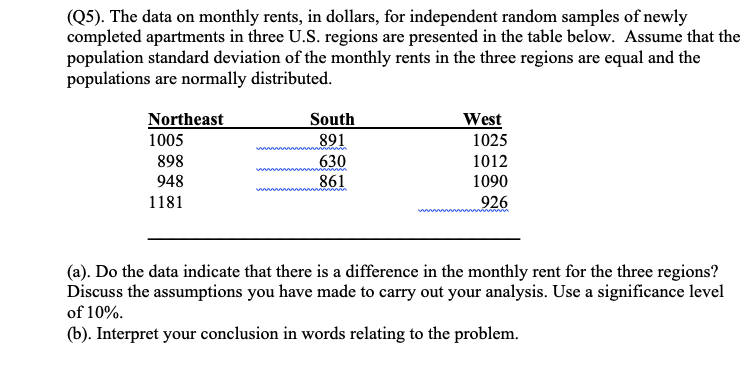
Transcribed Image Text:(Q5). The data on monthly rents, in dollars, for independent random samples of newly
completed apartments in three U.S. regions are presented in the table below. Assume that the
population standard deviation of the monthly rents in the three regions are equal and the
populations are normally distributed.
Northeast
1005
South
891
630
861
West
1025
898
1012
948
1090
1181
926
www
(a). Do the data indicate that there is a difference in the monthly rent for the three regions?
Discuss the assumptions you have made to carry out your analysis. Use a significance level
of 10%.
(b). Interpret your conclusion in words relating to the problem.
Expert Solution
This question has been solved!
Explore an expertly crafted, step-by-step solution for a thorough understanding of key concepts.

This is a popular solution!

Trending now
This is a popular solution!

Step by step
Solved in 3 steps with 4 images

Knowledge Booster


Learn more about
Need a deep-dive on the concept behind this application? Look no further. Learn more about this topic, statistics and related others by exploring similar questions and additional content below.Recommended textbooks for you
Glencoe Algebra 1, Student Edition, 9780079039897…
Algebra
ISBN:
9780079039897
Author:
Carter
Publisher:
McGraw Hill
Glencoe Algebra 1, Student Edition, 9780079039897…
Algebra
ISBN:
9780079039897
Author:
Carter
Publisher:
McGraw Hill