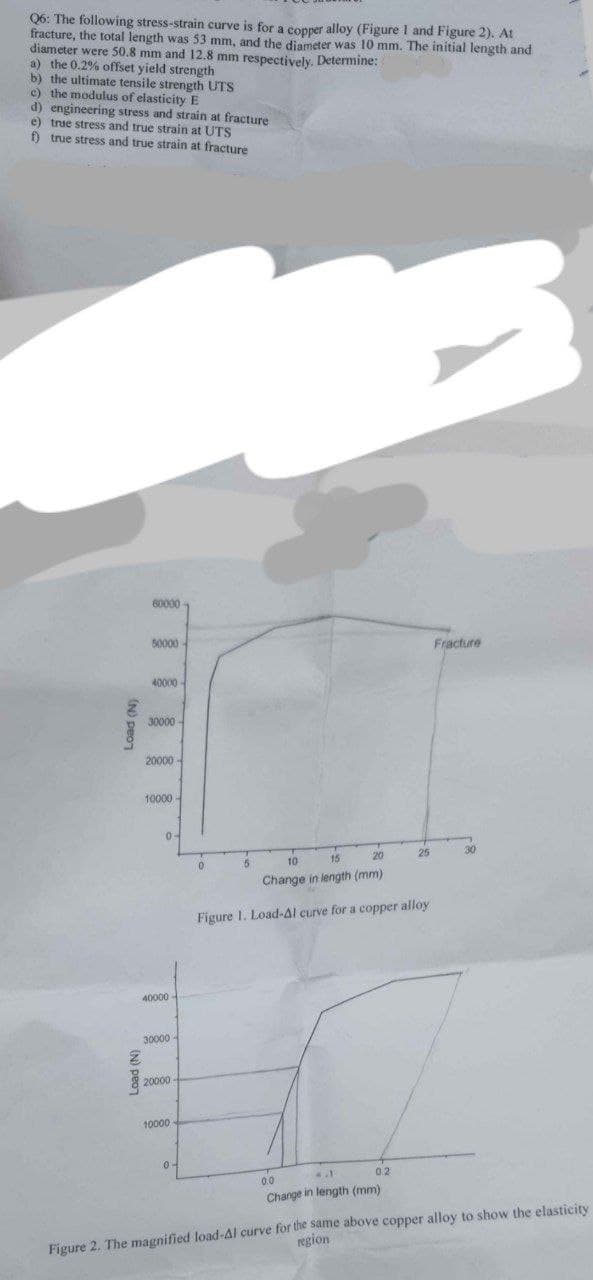
Q6: The following stress-strain curve is for a copper alloy (Figure 1 and Figure 2). At fracture, the total length was 53 mm, and the diameter was 10 mm. The initial length and diameter were 50.8 mm and 12.8 mm respectively. Determine: a) the 0.2% offset yield strength b) the ultimate tensile strength UTS c) the modulus of elasticity E d) engineering stress and strain at fracture e) true stress and true strain at UTS f) true stress and true strain at fracture V
Q6: The following stress-strain curve is for a copper alloy (Figure 1 and Figure 2). At fracture, the total length was 53 mm, and the diameter was 10 mm. The initial length and diameter were 50.8 mm and 12.8 mm respectively. Determine: a) the 0.2% offset yield strength b) the ultimate tensile strength UTS c) the modulus of elasticity E d) engineering stress and strain at fracture e) true stress and true strain at UTS f) true stress and true strain at fracture V

Elements Of Electromagnetics
7th Edition
ISBN:9780190698614
Author:Sadiku, Matthew N. O.
Publisher:Sadiku, Matthew N. O.
ChapterMA: Math Assessment
Section: Chapter Questions
Problem 1.1MA

Related questions
Question
Transcribed Image Text:Q6: The following stress-strain curve is for a copper alloy (Figure 1 and Figure 2). At
fracture, the total length was 53 mm, and the diameter was 10 mm. The initial length and
diameter were 50.8 mm and 12.8 mm respectively. Determine:
a) the 0.2% offset yield strength
b) the ultimate tensile strength UTS
c) the modulus of elasticity E
d) engineering stress and strain at fracture
e) true stress and true strain at UTS
f) true stress and true strain at fracture
(N)
Load (N)
60000-
50000
40000-
30000-
20000
10000
0-
40000-
30000
20000
10000-
04
10
15
20
Change in length (mm)
Figure 1. Load-Al curve for a copper alloy
0
5
0.2
0.0
Change in length (mm)
Fracture
region
Figure 2. The magnified load-Al curve for the same above copper alloy to show the elasticity
Expert Solution
This question has been solved!
Explore an expertly crafted, step-by-step solution for a thorough understanding of key concepts.

Step by step
Solved in 2 steps with 1 images

Knowledge Booster


Learn more about
Need a deep-dive on the concept behind this application? Look no further. Learn more about this topic, mechanical-engineering and related others by exploring similar questions and additional content below.Recommended textbooks for you
Elements Of Electromagnetics
Mechanical Engineering
ISBN:
9780190698614
Author:
Sadiku, Matthew N. O.
Publisher:
Oxford University Press

Mechanics of Materials (10th Edition)
Mechanical Engineering
ISBN:
9780134319650
Author:
Russell C. Hibbeler
Publisher:
PEARSON

Thermodynamics: An Engineering Approach
Mechanical Engineering
ISBN:
9781259822674
Author:
Yunus A. Cengel Dr., Michael A. Boles
Publisher:
McGraw-Hill Education
Elements Of Electromagnetics
Mechanical Engineering
ISBN:
9780190698614
Author:
Sadiku, Matthew N. O.
Publisher:
Oxford University Press
Mechanics of Materials (10th Edition)
Mechanical Engineering
ISBN:
9780134319650
Author:
Russell C. Hibbeler
Publisher:
PEARSON
Thermodynamics: An Engineering Approach
Mechanical Engineering
ISBN:
9781259822674
Author:
Yunus A. Cengel Dr., Michael A. Boles
Publisher:
McGraw-Hill Education

Control Systems Engineering
Mechanical Engineering
ISBN:
9781118170519
Author:
Norman S. Nise
Publisher:
WILEY

Mechanics of Materials (MindTap Course List)
Mechanical Engineering
ISBN:
9781337093347
Author:
Barry J. Goodno, James M. Gere
Publisher:
Cengage Learning

Engineering Mechanics: Statics
Mechanical Engineering
ISBN:
9781118807330
Author:
James L. Meriam, L. G. Kraige, J. N. Bolton
Publisher:
WILEY