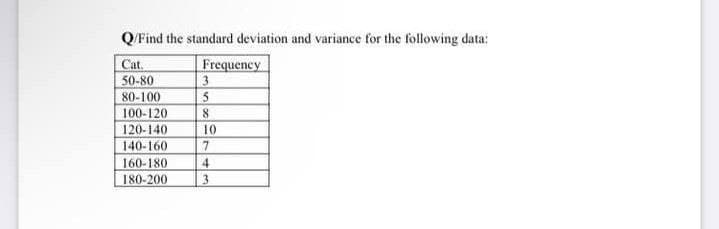
Q/Find the standard deviation and variance for the following data: Cat. 50-80 Frequency 80-100 5 100-120 120-140 10 140-160 160-180 180-200


Q: Which of the following could we find by examining a boxplot for a set of data?: I. mean II. median…
A: Given that, Which of the following could we find by examining a boxplot for a set of data?
Q: The following data provided are the average hours fifty-six grade 8 students spent doing their…
A: Given: The lowest amount of hours recorded is 5 hours (every 5 school days), and the highest is 34…
Q: Find Variance and Standard deviation for the following data. 4, 4, 7, 11, 14.
A: Given sample xi is: 4, 4, 7, 11, 14 Sample size, n = 5 Sample mean can be calculated as:…
Q: Which of the following best illustrate continuous unimodal data? A. histogram B. bar chart C. box…
A: Given two problems related to continuous unimidel data and Box plot. We have to choose the correct…
Q: Age (yr) of Best Actress When Oscar was won Frequency 20-29 29 30-39 34 Find the mean of the data…
A: Given information: The grouped frequency distribution table is provided as: Age Frequency (f)…
Q: What table should be used if the point estimator is the variance or standard deviation? A.) Z…
A: What table should be used if the point estimator is the variance or standard deviation Option C. is…
Q: a) Frequency (f) fx X? efi 15 6 90 1350 225 6 20 11 220 4400 400 17 25 17 425 10625 625 34 30 24 720…
A: Note: "Since you have posted a question with multiple sub -parts, we will solve first three sub…
Q: Find the variance and standard deviation of the data
A: Given data, x=5,6,8,9,10,11,14 The sample mean is
Q: The range and the variance are both measures of distance.
A: Solution-: The range and the variance are both measures of distance.
Q: Find the range and standard deviation of the set of data. 11, 10, 5, 12, 12 O
A: The detailed solution is as follows below:
Q: Q2 : A: Find the standard deviation and variance of the following data classes 10- 13- 16- 19-22…
A: Given data is Classes 10- 13- 16- 19-22 frequency 4 12 20 14 Class width = Upper class limit…
Q: Find the range and standard deviation of the set of data. 12, 9, 7, 11, 11 O
A: Given data: 12, 9, 7, 11, 11
Q: Use the following data set (2,3,4,4,6,7,8,12) The variance=10.5 Find the standard deviation and…
A: We have given that, The data set is, 2, 3, 4, 4, 6, 7, 8, 12 And variance = 10.5…
Q: 1. Find the mean, the variance and the standard deviation for the data. {18, 18, 19, 18, 18, 25, 29,…
A: Given data is : 18,18,19,18,18,25,29,30,26,19 To find mean, standard deviation, and variance.
Q: Which of the following is NOT a measure of the spread or dispersion of a set of data? a Standard…
A: The measure of dipersion is a measure that measures whether the data is uniformly distributed or…
Q: From the data below find Mean, Variance, and Standard Deviation. X Y 120…
A:
Q: Which of the following is not a measure of the dispersion of data in a sample
A: Here Given MAD,Variance ,IQR , Mean deviation
Q: The mean deviation of the data(1 * :2,9,9,3,6,9,4 from the mean is 2.23 3.23 O 2.57 O 3.57 O
A:
Q: d the mean, variance and standard deviation of the following data: X 19 20 21 22 23 P(X) 0.2 0.2 0.3…
A: From the given information we find the solution.
Q: Which of the following does NOT reveal the variation (spread) of the data? Check all that apply.…
A: A measure of central tendency helps to identify the location of a dataset, whereas a measure of…
Q: Find the range and standard deviation of the set of data. 10,9,6,12,18
A: The set of data 10,9,6,12,18
Q: A. MEAN, MEDIAN AND MODE FOR UNGROUPED DATA 1. Find variance and standard deviation for the LDL…
A: Given that 1) the data is arranging in ascending order to find the mean, median, and mode
Q: Calculate the standard deviation and variance of the data shown, to two decimal places X. 20.7 28.5…
A: The given data is: x 20.7 28.5 20.9 2.8 12.5 13.7 27.8 The mean for the data (μ)…
Q: The ages (in years) of a random sample of shoppers at a gaming store are shown. Determine the range,…
A: We have to calculate some summary statistics for given data.
Q: The following data provided are the average hours fifty-six grade 8 students spent doing their…
A: Range is the difference between largest and smallest observation. And variance is the measure of…
Q: What table should be used if the population variance or standard deviation is unknown? A.) Z…
A: Basics: Z distribution table is releated with population standard deviation t distribution table is…
Q: Use software or a calculator to find the range, variance, and standard deviation of the following…
A: Measure of central tendency measures the central or average value of a dataset. Measured of…
Q: The following are the number of cars passing a point on a highway per minute. 10 12 11 19 21…
A: Given raw data for for passing of cars : We have to calculate mean, median, mode, standard deviation…
Q: The difference between the largest and the smallest data values is the А. variance В. interquartile…
A:
Q: Use the Sample Variance Definition to find the variance and standard deviation of the data. Round…
A: Consider the provided question, Let X is the sample data sets. Given X = 4, 8, 6, 3, 8, 25 N = 6
Q: Look for the following: Mean, Median, Mode, Variance Standard Deviation, and z-score. Class…
A:
Q: Which of the following measure the average deviation of a data set? 1. sample range 2. sample…
A: Variance: The average of the square of the deviations taken from the mean is called variance. Sample…
Q: Calculate the variance and standard deviation of the sample data shown, to two decimal places X 16.6…
A:
Q: Give the TI commands to find the mean, median, and standard deviation and compare to the original…
A: TI Calculator
Q: Determine the following:a. The value of a consistent with N = 6 in moving averages.b. The value of N…
A: a) Consider the relation N+12=1αα=2N+1N=2α-1 The required value is calculated as follows: α=2N+1…
Q: Histogram: fines paid by drivers 12 10 4. 1 2 3 More Number of fines paid a year by a driver Compute…
A:
Q: Q/ Find the following data (6, 8, 5 2, 4, 3, 7, 9) 1. Range. 2. Average absolute deviation. 3.…
A:
Q: a) Determine the values of * and **. b) Give the unbiased point estimate for the average monthly…
A: As per our guidelines, we are allowed to answer three sub-parts. Thanks, Please post other parts…
Q: The ages in years of a random sample of shoppers at a gaming store are shown. Determine the range,…
A:
Q: What table should be used if the population variance or standard deviation is given? A.) Z…
A: We know that- If the population variance or standard deviation is known then we have to use the Z…
Q: Calculate the standard deviation and variance of the data shown, to two decimal places 8.9 18.5 9.7…
A: Use the given data to form excel table: x x-x¯ x-x¯2 8.9 -6.75 45.5625…
Q: Find the range and standard deviation of the set of data. 11, 9, 7, 11, 12 e
A: Given data, 11,9,7,11,12 Range=? Sd=?
Q: Q2 – For the data in table (1): / 1- Draw the frequency distribution diagram. 2 - Find the class…
A: (1) Draw the frequency distribution diagram. The frequency distribution diagram is plotted below as…
Q: (B) Flow fate was mC pred for a week, and the following values were recorded as gai/min: 9.7, 8.8,…
A:
Q: The wholesale price of a commodity for seven consecutive days in a month is as follows: Days…
A:
Q: Two accounting professors decided to compare the variance of their grading procedures. To accomplish…
A: The variance of grading procedure for Professor 1 is σ12 and the variance of grading procedure for…
Q: 1 2 3 4 5 6 7 8 9 10 11 12 2 6,2 1, 5, 2,7 7,8,4 2,5 3,6 2 6 where 7 | 2 = 72 students Calculate the…
A: Solution-: We have get following data from the stem-and-leaf plot: xi:…
Q: Find the range, variance, and standard deviation for the given sample data. Include appropriate…
A: From the provided information, Minimum value of data = 0.61 Maximum value of data = 1.28 The range…

Step by step
Solved in 2 steps with 2 images
