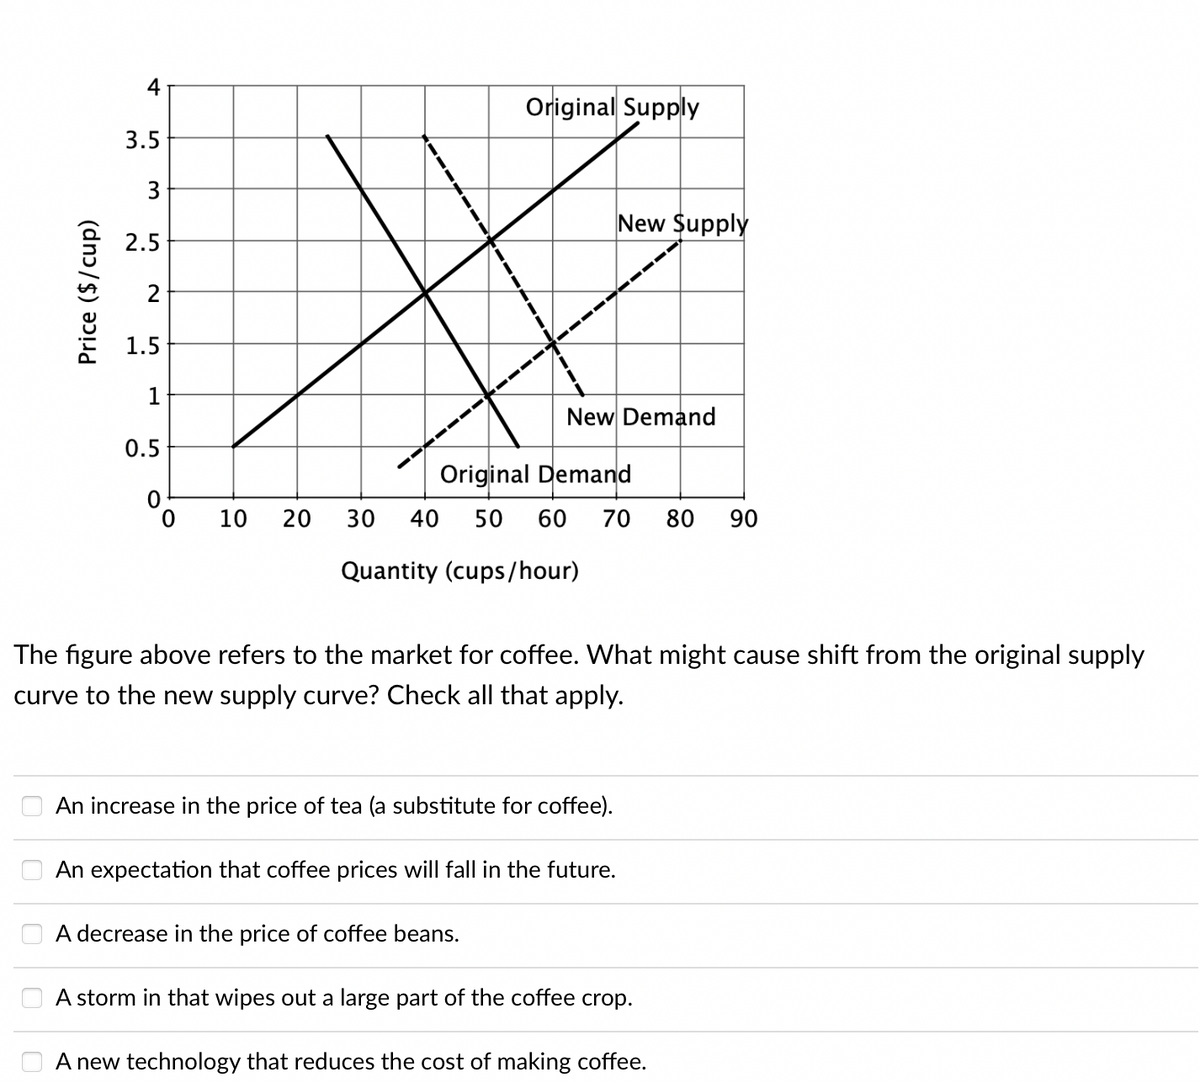
Quantity (cups/hour) The figure above refers to the market for coffee. What might cause shift from the original supply curve to the new supply curve? Check all that apply. An increase in the price of tea (a substitute for coffee). An expectation that coffee prices will fall in the future. A decrease in the price of coffee beans. A storm in that wipes out a large part of the coffee crop. A new technology that reduces the cost of making coffee.
Quantity (cups/hour) The figure above refers to the market for coffee. What might cause shift from the original supply curve to the new supply curve? Check all that apply. An increase in the price of tea (a substitute for coffee). An expectation that coffee prices will fall in the future. A decrease in the price of coffee beans. A storm in that wipes out a large part of the coffee crop. A new technology that reduces the cost of making coffee.

Microeconomics A Contemporary Intro
10th Edition
ISBN:9781285635101
Author:MCEACHERN
Publisher:MCEACHERN
Chapter5: Elasticity Of Demand And Supply
Section: Chapter Questions
Problem 14PAE

Related questions
Question
Transcribed Image Text:Price ($/cup)
3.5
3
88
2.5
2
1.5
1
0.5
0
10 20
Original Supply
New Supply
New Demand
Original Demand
30 40 50 60 70 80 90
Quantity (cups/hour)
The figure above refers to the market for coffee. What might cause shift from the original supply
curve to the new supply curve? Check all that apply.
An increase in the price of tea (a substitute for coffee).
An expectation that coffee prices will fall in the future.
A decrease in the price of coffee beans.
A storm in that wipes out a large part of the coffee crop.
A new technology that reduces the cost of making coffee.
Expert Solution
This question has been solved!
Explore an expertly crafted, step-by-step solution for a thorough understanding of key concepts.

Step by step
Solved in 4 steps

Knowledge Booster


Learn more about
Need a deep-dive on the concept behind this application? Look no further. Learn more about this topic, economics and related others by exploring similar questions and additional content below.Recommended textbooks for you


Managerial Economics: A Problem Solving Approach
Economics
ISBN:
9781337106665
Author:
Luke M. Froeb, Brian T. McCann, Michael R. Ward, Mike Shor
Publisher:
Cengage Learning

