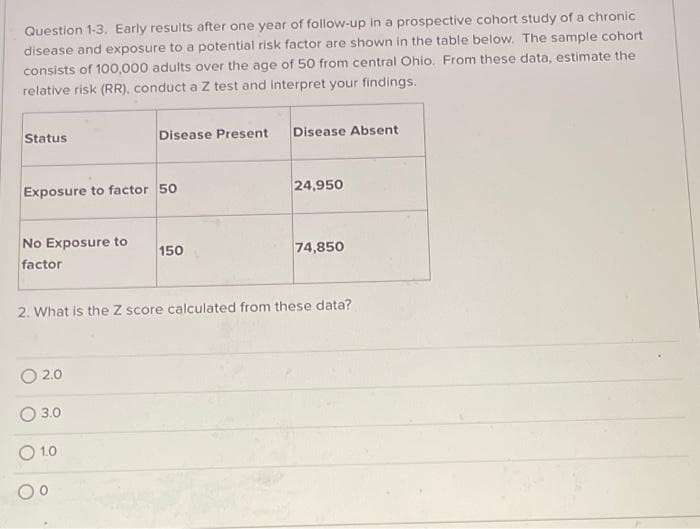
Question 1-3. Early results after one year of follow-up in a prospecti disease and exposure to a potential risk factor are shown in the table below. The sample cohort consists of 100,000 adults over the age of 50 from central Ohio. From these data, estimate the relative risk (RR), conduct a Z test and interpret your findings. Status Disease Present Disease Absent Exposure to factor 50 24,950 No Exposure to factor 150 74,850 2. What is the Z score calculated from these data?


Q: Question 9 Suppose you got three observations, shown in the table below. 3 -1 2 -5 1 3 Calculate the...
A: We have given that, The data set, X :- 3, 2, 1 Y:- -1, -5, 3 Then, We will find the correlation b...
Q: After graduating from college in 2010, Art Major's starting salary is $30757.00. Suppose Art Major h...
A:
Q: In 2017, the entire fleet of light‑duty vehicles sold in the United States by each manufacturer must...
A: Given : Mean (μ) = 86 Standard deviation (σ) = 5 Sample size of cars (n) =36 Let X be a r.v X~N(μ=36...
Q: Use the table to find the area to the right of t = 1.717 with 22 degrees of freedom. Area to the rig...
A: The value of t statistic is 1.717 with 22 degrees of freedom.
Q: 3) Calculate the mean, the median and the mode of each of the following data sets a. 2, 3, 4, 5, 7, ...
A: Mean = ΣXi/n Here sample size is n= 7 Mean = (2+3+4+5+7+7+7)/7 =35/7 = 5 Here 7 occurs highest times...
Q: A card is drawn from the pack of 52 cards. This experiment is repeated 20 times. The probability dis...
A: Given data is X 1 2 3 4 P(X) 12/20 2/20 2/20 4/20
Q: Nuclear power: The following table presents the number of nuclear reactors as of August 2, 2013, In ...
A: Given data is2,1,7,2,2,19,18,6,4,9,4,20,1,2,1,3,2,33,4,2,23,10,15,100
Q: 3. If (X(t)} is a WSS process and if Y(t) = h(u) X(t – u)du, then (i) Ryy (T) = R(T)* h(-t) and (ii)...
A:
Q: 4. A box contains 4 green and 2 blue dice. Three dice are chosen one after the other. Determine the ...
A: Given,no.of green dice=4no.of blue dice=2Total no.of dice=6
Q: IfS-(0, 1, 2, 3, 4, 5, 6, 7, 8, 9), and A- (0, 2. 4, 6, 8), B-(1, 3, 5, 7, 9). C (4, 5, 6, 7), and D...
A:
Q: A departmental store, P, has four competitors: Q, R, S, and T. Store P hires a consultant to determi...
A: The categorical variable is Store. There are 5 stores which follows Chi-square distribution. We have...
Q: Two samples of 6 and 5 items, respectively, gave the following data : Mean of tne first sample 40 St...
A: Given that, two samples of size 6 and 5 respectively, with the following data: Mean of first sample...
Q: Question 4-6. Results of a retrospective case control study of a chronic disease and exposure to a p...
A: Given data Z test Test statistics z = -6.3 P calue = ?
Q: 3 P(A and B) 10 27 find P(A) 200 Р (В) 2 Р (А аnd B) 5 3 find P(B) = 10 P(A) = P(B) = 0.25, P(A and ...
A: GivenP(B)=310P(A and B)=27200
Q: Question 4-6. Results of a retrospective case control study of a chronic disease and exposure to a p...
A:
Q: Attempt the following: (i) P(A) = 0.75, P(B) = 0.50 and P(A U B) = 0.87, are the events A and B inde...
A:
Q: Continuous Random Variables take on all possible values in an interval of numbers. The probability d...
A: A continuous random variable is a variable whose value can be obtained by measuring. A continuous ra...
Q: Page of Month Actual Sales Naive Forecast - Absolute Value of (# of Product X) Sales Errors (# of Pr...
A:
Q: Two samples of 6 and 5 items, respectively, gave the following data : Mean of tne first sample 40 St...
A:
Q: 3. Construct all random samples consisting two observations from the given data. You are asked to gu...
A:
Q: Lesson 12 Q1 What is the probability that the sum of the faces when rolling a pair of dice is seven...
A: GivenA pair of dice is rolledTotal no. of outcomes = 6×6=36(1,1)(1,2)(1,3)(1,4)(1,5)(1,6)(2,1)(2,2)(...
Q: A farmer brings his produce to the farmer's market and records whether people buy lettuce, apples, b...
A:
Q: The brain volumes (cm°) of 20 brains have a mean of 1125.3 cm° and a standard deviation of 127.2 cm°...
A:
Q: Answer Given that p be an n-dimensional random vector of zero mean and positive definite covariance ...
A: Given Information: Consider β be an n-dimensional random vector of zero mean and positive definite c...
Q: Question 1: The University of Professional Studies, Accra (UPSA) aims to evaluate students’ acade...
A: Introduction - Descriptive statistics - Descriptive statistics are numbers that are used to summariz...
Q: Question 5 The radius of a confidence interval is called the O confidence level O margin of error O ...
A:
Q: Construct a stem-and-leaf plot for the following data, in which the leaf represents the hundredths d...
A: For the given data Construct a stem and leaf plot
Q: b) Find the value of c for which this test will have a significance level of 0.05. (Give your answer...
A:
Q: The following data gives the profits of a firm (in lakh dollars). Interpolate the missing figures. 1...
A:
Q: The number of employees, wages per employee and the variance of the wages per employee for two facto...
A: Given The data is as follows: Factory A Factory B Number of employees 100 150 Average wages...
Q: find the upper and lower outlier boundaries by referencing the given information.
A: Given data is2,1,7,2,2,19,18,6,4,9,4,20,1,2,1,3,2,33,4,2,23,10,15,100Arrange the data in ascending o...
Q: 1. What does F-test for significance tell us? 2. What does t-test for significance tell us? 3. C...
A: Given information: What does F-test for significance tell us? 2. What does t-test for significance ...
Q: (b) (For Math 5090 students) Let X be an nxq data matrix, S its sample covariance matrix and y,, j =...
A: @solution::
Q: 3. Are the fomeming events indeponaent? Arswer kue or False'and ane a reasun. Ine first bab Don teda...
A:
Q: Two samples are drawn from two normal population. From the following data test whether the two sampl...
A: There are two independent samples which are sample 1 and sample 2. We have to test whether the two s...
Q: Determine a) whether or not X and Y are independent. b) the marginal distribution of X; c) the margi...
A: a. The given joint pdf is f(x,y)=32(x2+y2) 0≤x≤1, 0≤y≤1 f(x,y)=g(x)h(y) g and h ar...
Q: If X is a normal variate with mean 2 and variance 9, describe the distribution of Y=1/2(x-1).Also de...
A:
Q: In a trivariate distribution 01 = 2, 02 = 03 = 3 12 = 0-7, r23 = r31 = 0-5 %3D %3D %3D %3D Find (1) ...
A:
Q: Find the sample space of the following experiment using table. 1. tossing 4 coins and rolling a die ...
A: We need to find the sample space for given experiments.
Q: If the expected value for a five dollar raffle ticket is $0.85, then there is a 85% chance that the ...
A: here expected vaue is 0.85$ which means player expect to win 0.85$V on each game played on a long ru...
Q: 16. Missing class, continued e) Interpret the R2 value: 0.8976. This number is fairly close to 1- wh...
A: Coefficient of determination, r2: The coefficient of determination (r2) is the amount of variation i...
Q: Unit 4 – Probability, Random Variables, and Probability Distributions Notes 3 – Discrete and Continu...
A:
Q: Suppose a die is tossed, let A be the event of “an even number turning up” and B be the event of “an...
A:
Q: The Green party of Canada is planning on conducting a survey to estimate the proportion of Canadians...
A:
Q: What is the probability of getting a tail when tossing a coin? A.zero B.1/4 C.1/2 D.3/4
A:
Q: If a random variable X follows normal distribution with mean 10 and standard deviation 50, write dow...
A:
Q: A sample survey of 59 discount brokers showed that the mean price charged for a trade of 100 shares ...
A: Given Data : Sample Size, n = 50 Sample Mean, x̄ = 33.75 standard devi...
Q: The scale of the correlation coefficient is: a. nominal
A: Qualitative variables: The variables which having the distinct categories are known as qualitative ...
Q: Price of eggs and milk: The following table presents the average price in dollars for a dozen eggs a...
A:
Q: Let B be an n-dimensional random vector of zero mean and positive- definite covariance matrix Q. Sup...
A: Given Information: Consider β be an n-dimensional random vector of zero mean and positive definite c...


Trending now
This is a popular solution!

Step by step
Solved in 3 steps with 1 images

- QUESTION 12 Historically, the proportion of people who trade in their old car to a car dealer when purchasing a new car is 48%. Over the previous 6 months, in a sample of 115 new-car buyers, 46 have traded in their old car. To determine (at the 10% level of significance) whether the proportion of new-car buyers that trade in their old car has statistically significantly decreased, what can you conclude concerning the null hypothesis? Reject the null hypothesis Fail to reject the null hypothesisQuestion #4. US Universities found that 72% of people are concerned about the possibility that their personal records could be stolen over the Internet. If a random sample of 300 college students at a Midwestern university were taken and 228 of them were concerned about the possibility that their personal records could be stolen over the Internet, could you conclude at the 0.025 level of significance that a higher proportion of the university's college students are concerned about Internet theft than the public at large? Report the p-value for this test. Z0.025 = 1.96QUESTION 25 A clinical trial is being conducted in order to determine the efficacy of a new drug used to treat Rheumatoid arthritis. The efficacy of the medication will not only be determined by the physical improvement of symptoms but also by using a blood test to examine the concentration C-reactive protein (an inflammatory marker) in an individual’s blood. If the researcher wants a margin of error for the level of C-reactive protein to be less than or equal to 3.0 mg/dL, and if the standard deviation for C-reactive protein concentrations among arthritis patients was previously documented at 8 mg/dL, how many patients should be recruited for each group in the study assuming a 95% confidence interval will be used to quantify the mean differences between the control group and the treatment group? nfor the treatment group = 112; n for the control group = 111 nfor the treatment group = 56; n for the control group = 57 nfor the treatment group = 55; n…
- question 4 Chen et al. (2000) examined the foraging behaviour of northern elephant seals (Mirounga angustirostris) that breed along the west coast of Mexico and the USA. They attached platform satellite transmitter terminals (PTTs) to 22 male seals and recorded, for each seal, the distance (km) to its main feeding area offshore and the amount of time (days) it spent at the feeding area. The results are presented below: What two null hypotheses are being tested with the output shown above? What statistical conclusions would you draw about these hypotheses? Complete the regression equation by filling in the blanks (to the nearest 3 decimal places). duration = + * distance What is one biological interpretation of this relationship between duration and distance ? What % of the variation in duration at main feeding area was explained by distance to feeding area?Question 7 Consider a cohort study to compare the mortality rate of myocardial infarction (MI) in men with sedentary work (exposed group) to men with physically active work (unexposed). If in the exposed, there were 36,000 person (man) years of observation and 126 deaths whereas the unexposed had 24,000 man-years of observation and 44 deaths. Compute the following a) Mortality rate in each cohort? b) What is the relative risk of dying, comparing these 2 groups? c) What is the attributable risk of sedentary work? d) What is the attributable benefit of physical activity? e) If we assume that MI is associated with the mortality in this cohort (causality), what proportion of the disease in the higher group is potentially preventable?QUESTION 12 Historically, the proportion of people who trade in their old car to a car dealer when purchasing a new car is 48%. Over the previous 6 months, in a sample of 115 new-car buyers, 46 have traded in their old car. To determine (at the 10% level of significance) whether the proportion of new-car buyers that trade in their old car has statistically significantly decreased, what can you conclude concerning the null hypothesis?
- question (9): A researcher was interested in the effect of job security on stress. The researcher recruited a random sample of 10 individuals who had job security and 10 individuals who were employed on a 1 year contract. The researcher measured the stress hormone through a saliva sample. This is an independent sample design; TRUE OR FALSEQuestion 20 On the basis of data provided by a Romac Salary survey, the variance in annual salaries for seniors in public accounting firms is approximately 2.1 and the variance in annual salaries for managers in public accounting firms is approximately 11.1. The salary data were provided in thousands of dollars. Assuming that the salary data were based on samples of 25 seniors and 26 managers, test the hypothesis that the population variances in the salaries are equal. At a 0.05 level f significance, what is your conclusion?QUESTION 21 We have randomly selected 30 students from Section 1 and 25 students from Sections 2 of MSCI course at Utoronto from the last term. We recorded their grades A,B, C, D, or F. If we do a test on this data at 5% significance level, write down the critical value
- Question 8:Research at the University of Toledo indicates that 50% of students change their major area of study after their first year in a program. A random sample of 100 students in the College of Business revealed that 48 had changed their major area of study after their first year of the program. Has there been a significant decrease in the proportion of students who change their major after the first year in this program? Test at the .05 level of significance.Question 2 There is a claim that drink driving has been very common in high ways. The Highway Police randomly caught 300 drivers for breath alcohol test and found that 14% of drivers have breath alcohol over the legal limit. At 4% level of significance, use the p-value approach to test the hypothesis that the percentage of drivers who are drink driving is more than 10%.Question 24: The US Department of Energy reported that 52% of homes were heated by natural gas. A random sample of 311 homes in Oregon found that 141 were heated by natural gas. Test the claim that proportion of homes in Oregon that were heated by natural gas is different than what was reported. Use a 5% significance level. Give answer to at least 4 decimal places. What are the correct hypotheses? (Select the correct symbols and use decimal values not percentages.) H0: H1: Based on the hypotheses, compute the following:Test Statistic = p-value = Based on the above we choose to The correct summary would be: that the proportion of homes in Oregon that were heated by natural gas is different than what the DOE reported value of 52%.