Question 1: A hospital in a large city records the weight of every infant born at the hospital. The distribution of weights is normally shaped with a mean u = 2.9 kg, and a standard deviation of 0.45. Determine the following: a. The percentage of infants who weighed less than 2.1 kilograms b. The percentile rank of a weight of 4.2 kilograms c. The percentage of infants who weighed between 1.8 and 4.0 kilograms
Question 1: A hospital in a large city records the weight of every infant born at the hospital. The distribution of weights is normally shaped with a mean u = 2.9 kg, and a standard deviation of 0.45. Determine the following: a. The percentage of infants who weighed less than 2.1 kilograms b. The percentile rank of a weight of 4.2 kilograms c. The percentage of infants who weighed between 1.8 and 4.0 kilograms

Glencoe Algebra 1, Student Edition, 9780079039897, 0079039898, 2018
18th Edition
ISBN:9780079039897
Author:Carter
Publisher:Carter
Chapter10: Statistics
Section10.4: Distributions Of Data
Problem 19PFA

Related questions
Question
100%
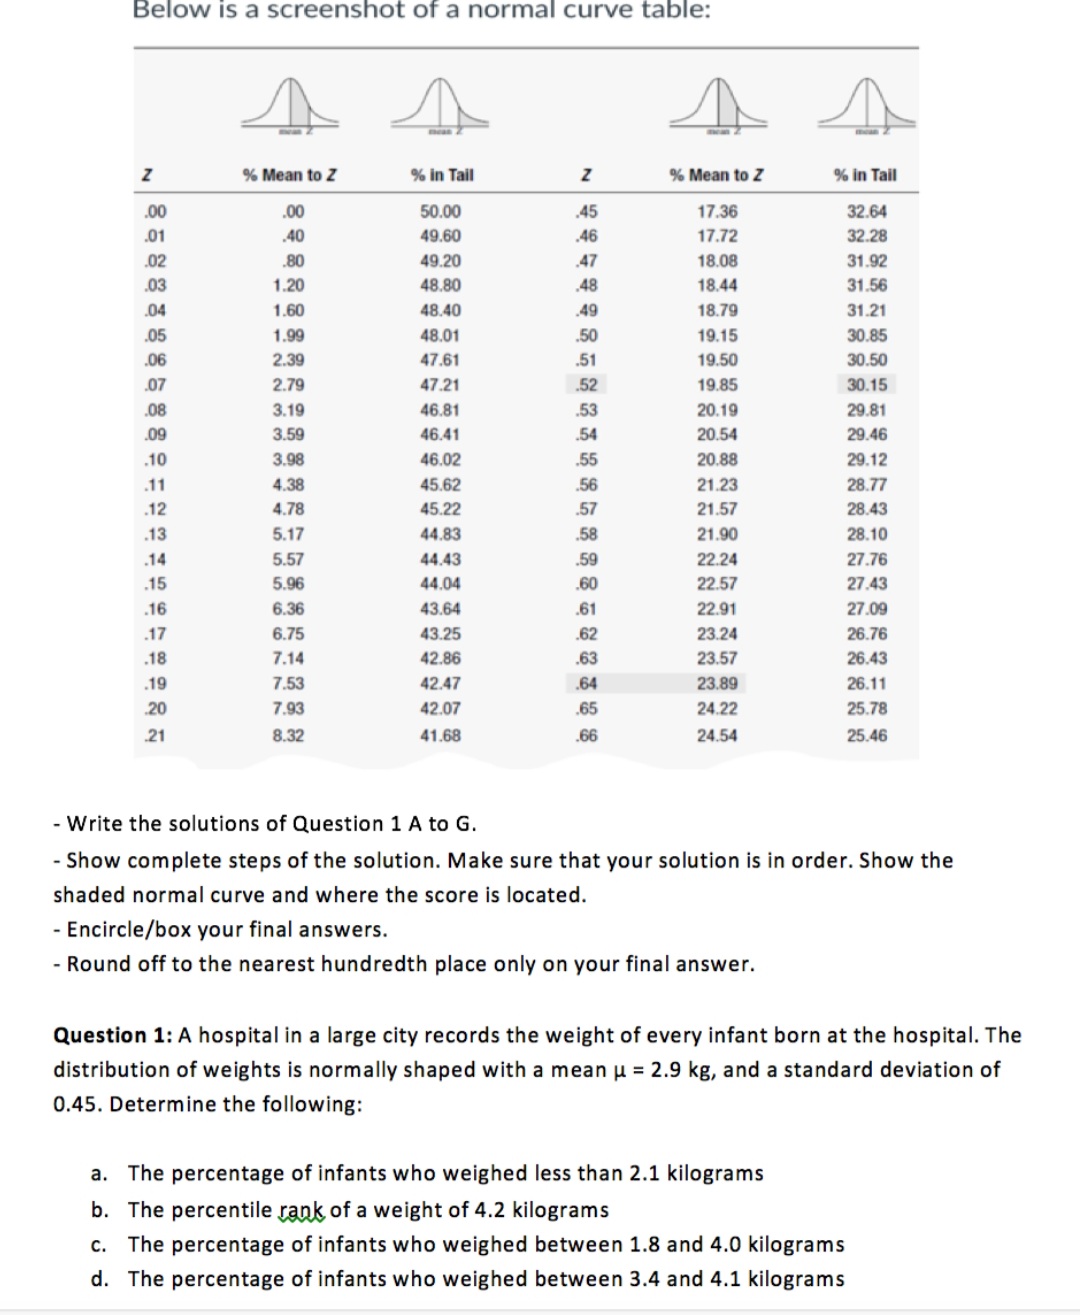
Transcribed Image Text:Below is a screenshot of a normal curve table:
% Mean to Z
% in Tail
% Mean to Z
% in Tail
.00
.00
50.00
45
17.36
32.64
.01
.40
49.60
.46
17.72
32.28
.02
.80
49.20
.47
18.08
31.92
.03
1.20
48.80
48
18.44
31.56
.04
1.60
48.40
49
18.79
31.21
.05
1.99
48.01
.50
19.15
30.85
.06
2.39
47.61
.51
19.50
30.50
.07
2.79
47.21
.52
19.85
30.15
.08
3.19
46.81
.53
20.19
29.81
.09
3.59
46.41
.54
20.54
29.46
.10
3.98
46.02
.55
20.88
29.12
.11
4.38
45.62
.56
21.23
28.77
.12
4.78
45.22
.57
21.57
28.43
.13
5.17
44.83
.58
21.90
28.10
.14
5.57
44.43
.59
22.24
27.76
.15
5.96
44.04
.60
22.57
27.43
.16
6.36
43.64
.61
22.91
27.09
.17
6.75
43.25
.62
23.24
26.76
.18
7.14
42.86
.63
23.57
26.43
.19
7.53
42.47
.64
23.89
26.11
20
7.93
42.07
.65
24.22
25.78
21
8.32
41.68
.66
24.54
25.46
- Write the solutions of Question 1 A to G.
- Show complete steps of the solution. Make sure that your solution is in order. Show the
shaded normal curve and where the score is located.
- Encircle/box your final answers.
- Round off to the nearest hundredth place only on your final answer.
Question 1: A hospital in a large city records the weight of every infant born at the hospital. The
distribution of weights is normally shaped with a mean u = 2.9 kg, and a standard deviation of
0.45. Determine the following:
a. The percentage of infants who weighed less than 2.1 kilograms
b. The percentile rank of a weight of 4.2 kilograms
c. The percentage of infants who weighed between 1.8 and 4.0 kilograms
d. The percentage of infants who weighed between 3.4 and 4.1 kilograms
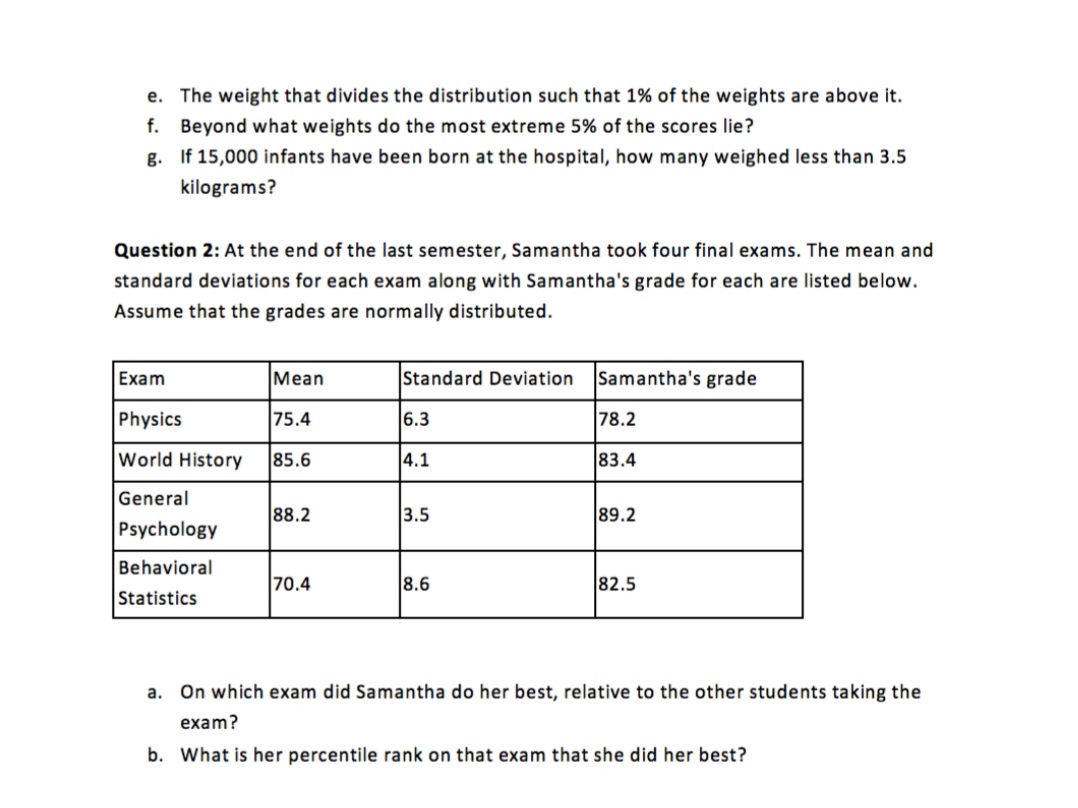
Transcribed Image Text:e. The weight that divides the distribution such that 1% of the weights are above it.
f. Beyond what weights do the most extreme 5% of the scores lie?
g. If 15,000 infants have been born at the hospital, how many weighed less than 3.5
kilograms?
Question 2: At the end of the last semester, Samantha took four final exams. The mean and
standard deviations for each exam along with Samantha's grade for each are listed below.
Assume that the grades are normally distributed.
Exam
Mean
Standard Deviation
Samantha's grade
Physics
75.4
6.3
78.2
World History
85.6
4.1
83.4
General
88.2
3.5
89.2
Psychology
Behavioral
70.4
8.6
82.5
Statistics
a. On which exam did Samantha do her best, relative to the other students taking the
exam?
b. What is her percentile rank on that exam that she did her best?
Expert Solution
This question has been solved!
Explore an expertly crafted, step-by-step solution for a thorough understanding of key concepts.

This is a popular solution!

Trending now
This is a popular solution!

Step by step
Solved in 3 steps with 2 images

Recommended textbooks for you
Glencoe Algebra 1, Student Edition, 9780079039897…
Algebra
ISBN:
9780079039897
Author:
Carter
Publisher:
McGraw Hill
Glencoe Algebra 1, Student Edition, 9780079039897…
Algebra
ISBN:
9780079039897
Author:
Carter
Publisher:
McGraw Hill