a) draw a scatterplot that is suitable for predicting test scores based on study time.please include labels for the x and y axis b) determine the shape of the best-fit model for the data (linear , quadratic, exponential, logarithmic sinusoidal). Why? c) find the best-fit regression model for the following data.
a) draw a scatterplot that is suitable for predicting test scores based on study time.please include labels for the x and y axis b) determine the shape of the best-fit model for the data (linear , quadratic, exponential, logarithmic sinusoidal). Why? c) find the best-fit regression model for the following data.

Algebra & Trigonometry with Analytic Geometry
13th Edition
ISBN:9781133382119
Author:Swokowski
Publisher:Swokowski
Chapter10: Sequences, Series, And Probability
Section10.2: Arithmetic Sequences
Problem 67E

Related questions
Question
a) draw a scatterplot that is suitable for predicting test scores based on study time.please include labels for the x and y axis
b) determine the shape of the best-fit model for the data (linear , quadratic, exponential, logarithmic sinusoidal). Why?
c) find the best-fit regression model for the following data.
d) what does the residual plot look like?
e) using the model found in predict the score of a who studies for show your for
f)what does a residual of 2 mean in context study time and test be?
Transcribed Image Text:8 8
EXATERUTHAcORSPc0sySTESVZX71D0/edita
BCBSNC-Tre Zore : mmercial are
Health Care Reform. s Customer Service a
88 Beconds ago
xE E - = - = =# | Et | E E = =| -0 a ∞ | TI 8
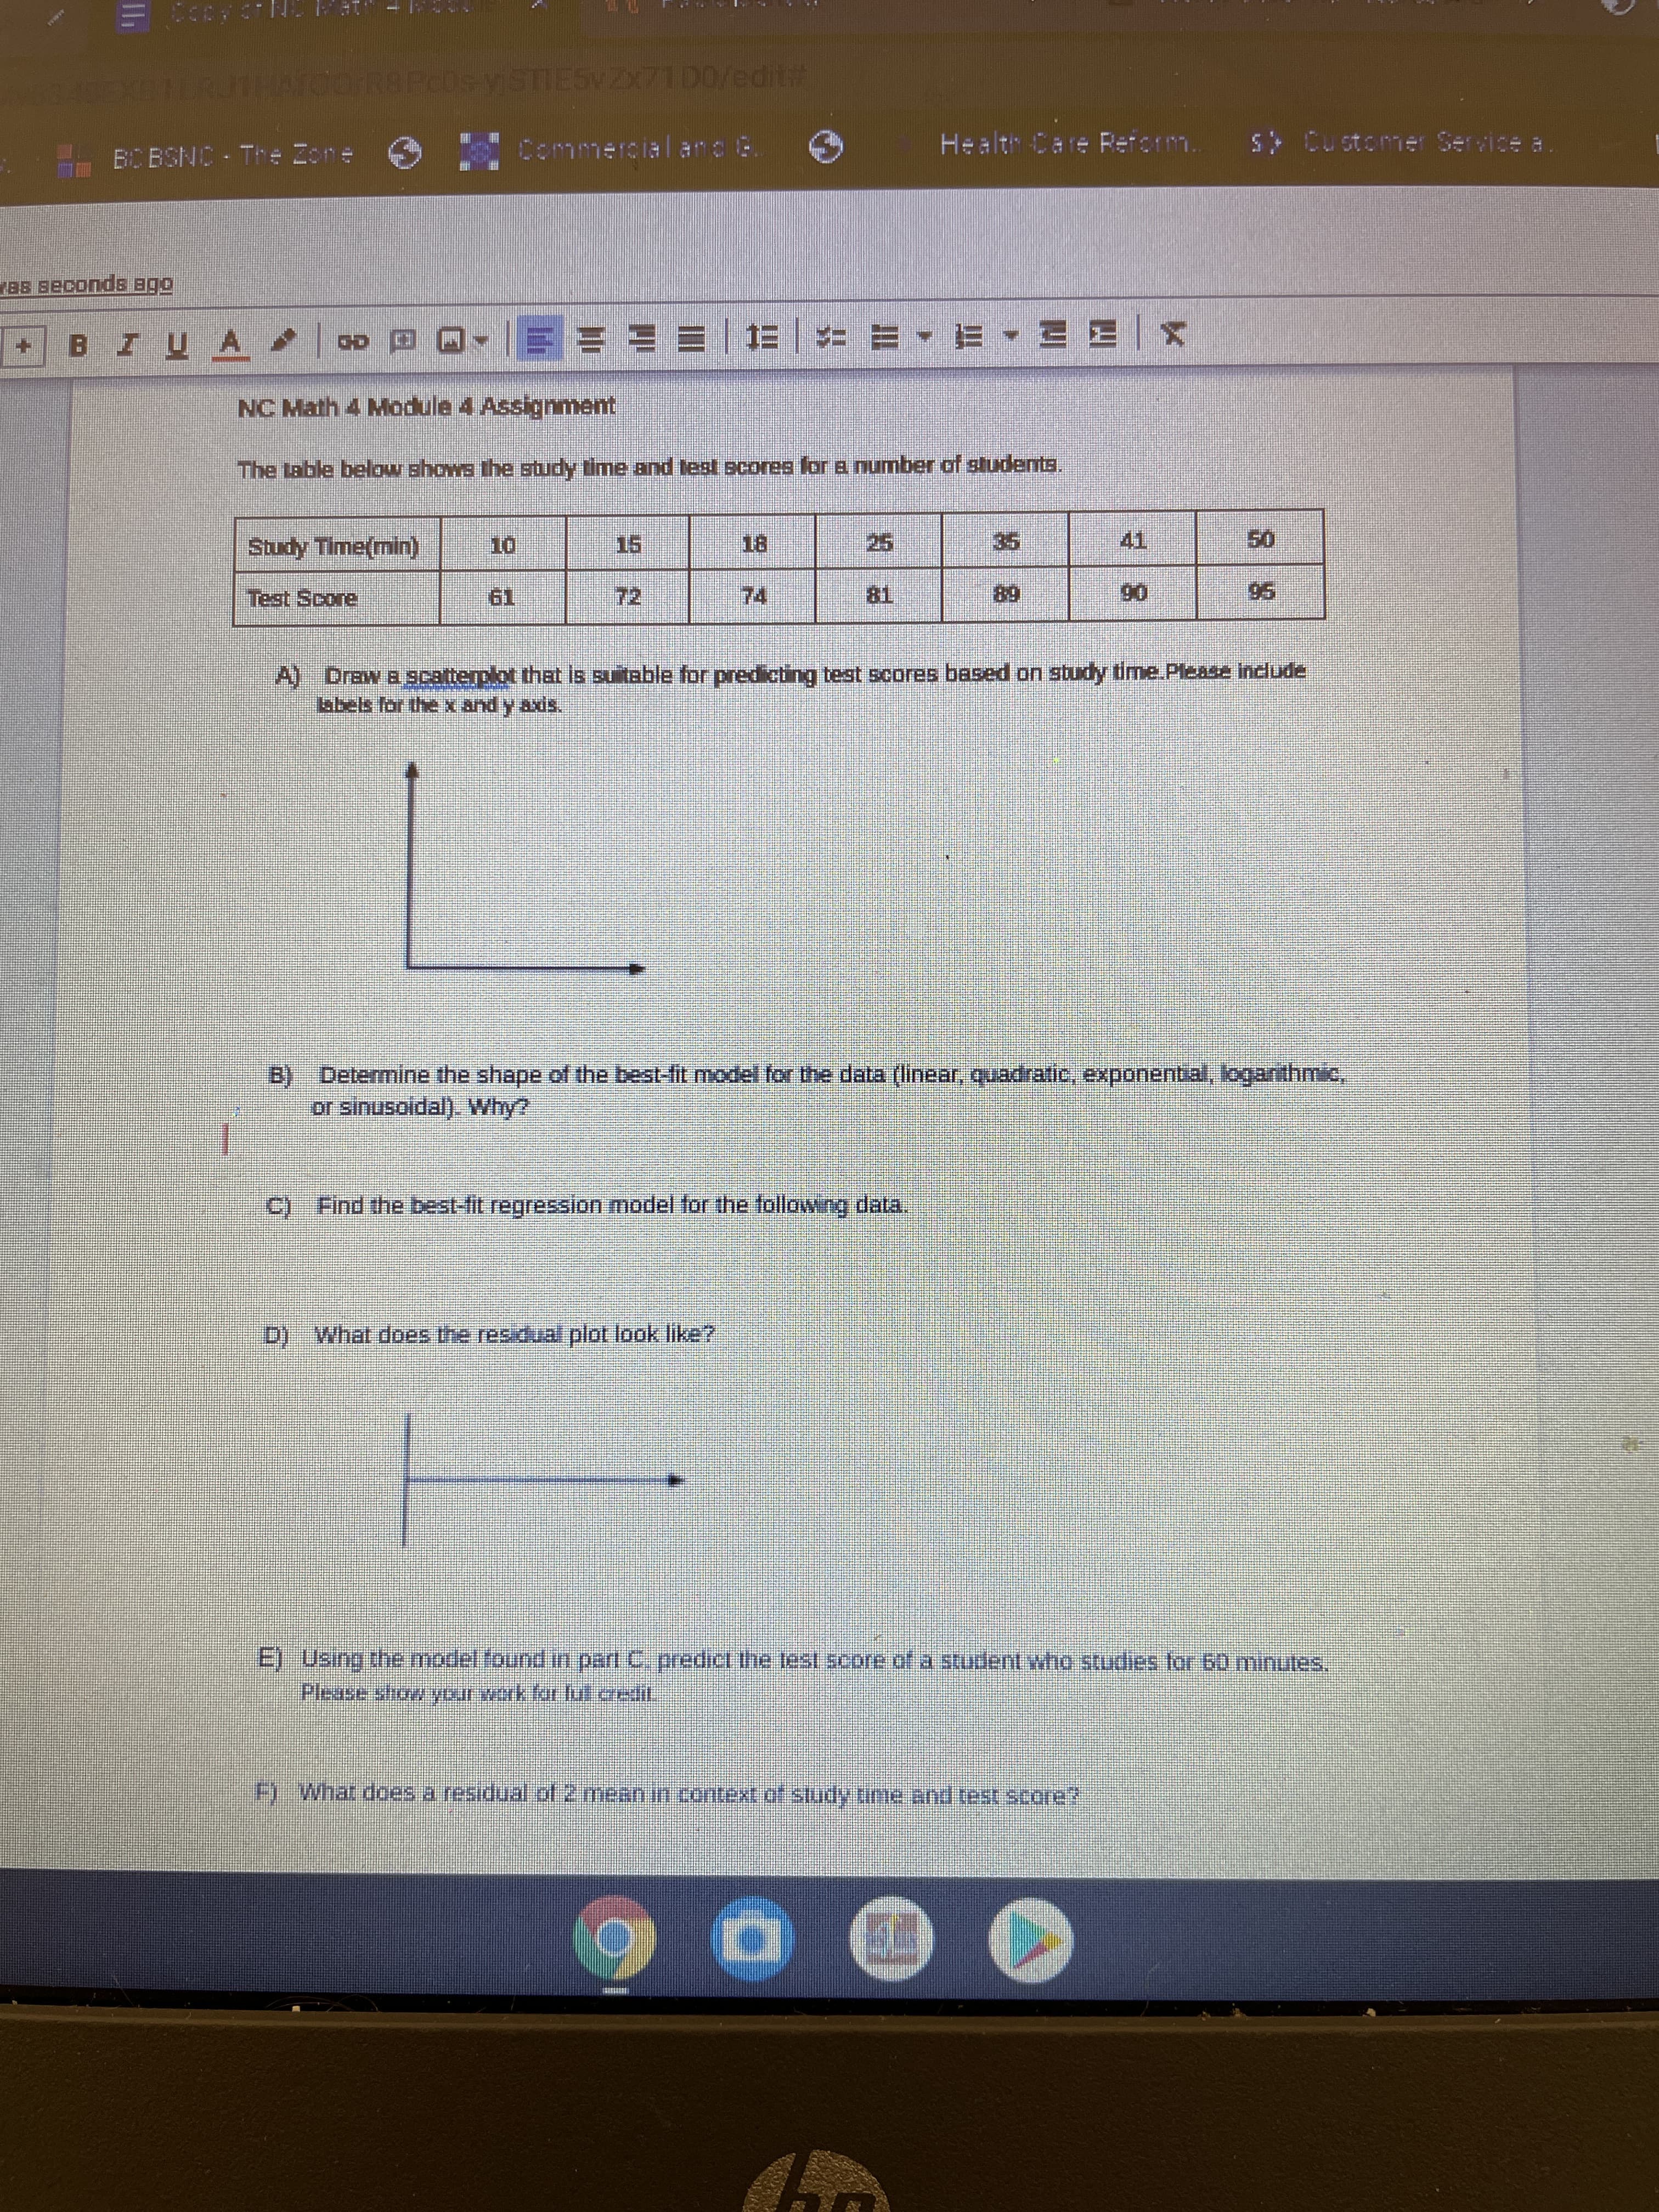
NC Math 4 Module 4 Assignment
The table below shows the study time and test scores for a number of students.
Study Time(min)
15
18
25.
41,
0.
Test Score
19
72
74.
96
68
A) Draw a scatterplot that is suitable for predicting test scores based on study time.Please include
bbels for thex and y axis.
B) Determine the shape of the best-fit model for the data (linear, quadratic, exponental, loganthmic,
or sinusoidal). Why?
C) Find the best-fit regression model for the following data.
D) What does the residual plot look like?
EJ Using the model found in parl C. predict the test score of a student who studies for 60 minutes,
F) What does a residual of 2 mean in context of study time and test score?
Expert Solution
This question has been solved!
Explore an expertly crafted, step-by-step solution for a thorough understanding of key concepts.

This is a popular solution!

Trending now
This is a popular solution!

Step by step
Solved in 4 steps with 2 images

Recommended textbooks for you
Algebra & Trigonometry with Analytic Geometry
Algebra
ISBN:
9781133382119
Author:
Swokowski
Publisher:
Cengage

Elementary Linear Algebra (MindTap Course List)
Algebra
ISBN:
9781305658004
Author:
Ron Larson
Publisher:
Cengage Learning

Linear Algebra: A Modern Introduction
Algebra
ISBN:
9781285463247
Author:
David Poole
Publisher:
Cengage Learning
Algebra & Trigonometry with Analytic Geometry
Algebra
ISBN:
9781133382119
Author:
Swokowski
Publisher:
Cengage
Elementary Linear Algebra (MindTap Course List)
Algebra
ISBN:
9781305658004
Author:
Ron Larson
Publisher:
Cengage Learning
Linear Algebra: A Modern Introduction
Algebra
ISBN:
9781285463247
Author:
David Poole
Publisher:
Cengage Learning