Question 1: A sample of size 80 is selected from a Population A yields a mean of 83 and a standard deviation of 12, and a sample of size 65 is selected from a Population B yields a mean of 67 and a standard deviation of 14. a. Find the standard error of the distribution of differences in sample means. b. Find the t-values for the endpoints of the t-distribution with 2.5% beyond them in each tail.
Question 1: A sample of size 80 is selected from a Population A yields a mean of 83 and a standard deviation of 12, and a sample of size 65 is selected from a Population B yields a mean of 67 and a standard deviation of 14. a. Find the standard error of the distribution of differences in sample means. b. Find the t-values for the endpoints of the t-distribution with 2.5% beyond them in each tail.

MATLAB: An Introduction with Applications
6th Edition
ISBN:9781119256830
Author:Amos Gilat
Publisher:Amos Gilat
Chapter1: Starting With Matlab
Section: Chapter Questions
Problem 1P

Related questions

Question
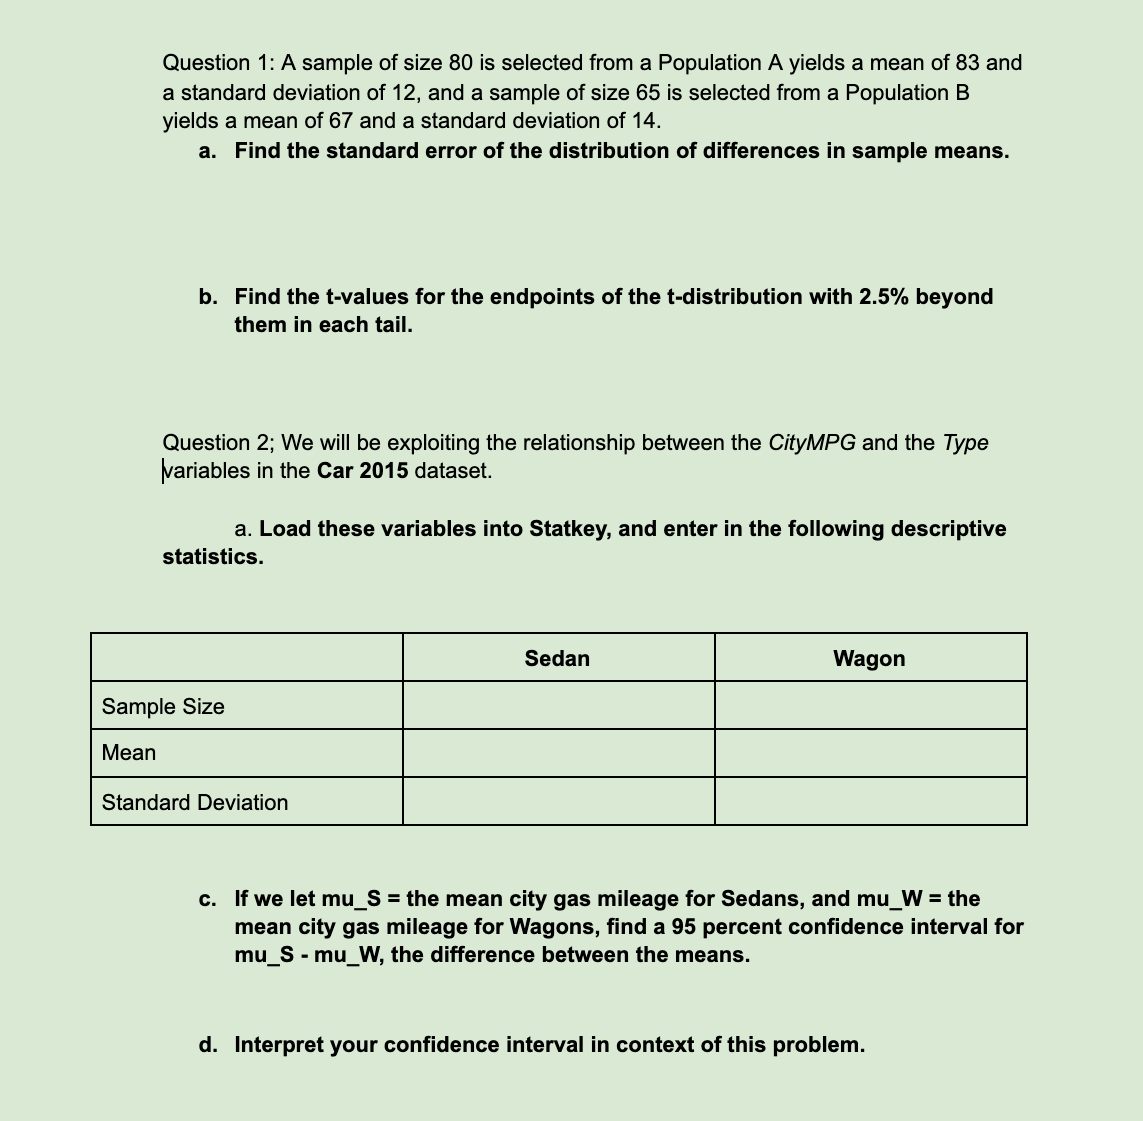
Transcribed Image Text:Question 1: A sample of size 80 is selected from a Population A yields a mean of 83 and
a standard deviation of 12, and a sample of size 65 is selected from a Population B
yields a mean of 67 and a standard deviation of 14.
a. Find the standard error of the distribution of differences in sample means.
b. Find the t-values for the endpoints of the t-distribution with 2.5% beyond
them in each tail.
Question 2; We will be exploiting the relationship between the CityMPG and the Type
variables in the Car 2015 dataset.
a. Load these variables into Statkey, and enter in the following descriptive
statistics.
Sedan
Wagon
Sample Size
Мean
Standard Deviation
c. If we let mu_S = the mean city gas mileage for Sedans, and mu_W = the
mean city gas mileage for Wagons, find a 95 percent confidence interval for
mu_S - mu_W, the difference between the means.
d. Interpret your confidence interval in context of this problem.
Expert Solution
This question has been solved!
Explore an expertly crafted, step-by-step solution for a thorough understanding of key concepts.

Step by step
Solved in 3 steps

Knowledge Booster


Learn more about
Need a deep-dive on the concept behind this application? Look no further. Learn more about this topic, statistics and related others by exploring similar questions and additional content below.Recommended textbooks for you
MATLAB: An Introduction with Applications
Statistics
ISBN:
9781119256830
Author:
Amos Gilat
Publisher:
John Wiley & Sons Inc

Probability and Statistics for Engineering and th…
Statistics
ISBN:
9781305251809
Author:
Jay L. Devore
Publisher:
Cengage Learning

Statistics for The Behavioral Sciences (MindTap C…
Statistics
ISBN:
9781305504912
Author:
Frederick J Gravetter, Larry B. Wallnau
Publisher:
Cengage Learning
MATLAB: An Introduction with Applications
Statistics
ISBN:
9781119256830
Author:
Amos Gilat
Publisher:
John Wiley & Sons Inc
Probability and Statistics for Engineering and th…
Statistics
ISBN:
9781305251809
Author:
Jay L. Devore
Publisher:
Cengage Learning
Statistics for The Behavioral Sciences (MindTap C…
Statistics
ISBN:
9781305504912
Author:
Frederick J Gravetter, Larry B. Wallnau
Publisher:
Cengage Learning

Elementary Statistics: Picturing the World (7th E…
Statistics
ISBN:
9780134683416
Author:
Ron Larson, Betsy Farber
Publisher:
PEARSON

The Basic Practice of Statistics
Statistics
ISBN:
9781319042578
Author:
David S. Moore, William I. Notz, Michael A. Fligner
Publisher:
W. H. Freeman

Introduction to the Practice of Statistics
Statistics
ISBN:
9781319013387
Author:
David S. Moore, George P. McCabe, Bruce A. Craig
Publisher:
W. H. Freeman