Question 1 Answer Part D only!!

MATLAB: An Introduction with Applications
6th Edition
ISBN:9781119256830
Author:Amos Gilat
Publisher:Amos Gilat
Chapter1: Starting With Matlab
Section: Chapter Questions
Problem 1P

Related questions
Question
Question 1
Answer Part D only!!
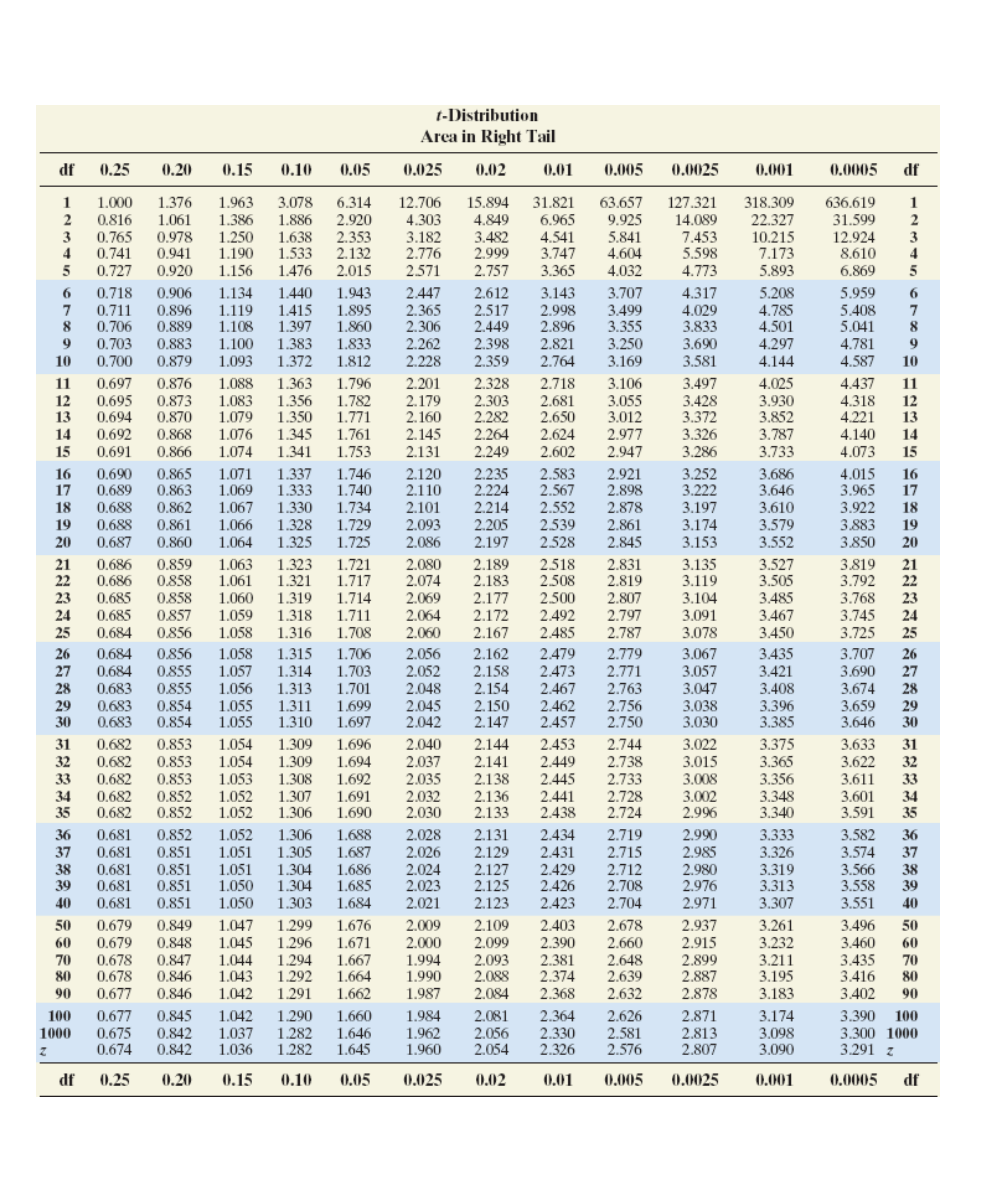
Transcribed Image Text:t-Distribution
Arca in Right Tail
df
0.25
0,20
0.15
0.10
0,05
0.025
0.02
0.01
0.005
0.0025
0.001
(0.0005
df
12.706
4.303
3.182
2.776
2571
15.894
4.849
3.482
2.999
31.821
6.965
4.541
3.747
3.365
63.657
9.925
5.841
4.604
4.032
127.321
14.089
7.453
5.598
4.773
318.309
22.327
10.215
7.173
5.893
636.619
31.599
12.924
8,610
6.869
1
1.000
1.376
1.963
1.386
1.250
1.190
3.078
6.314
2.920
2.353
2.132
2.015
2
0,816
0.765
0.741
0.727
1.061
0.978
0.941
0.920
1.886
1.638
1.533
1.476
2
3
3
5
1.156
2.757
5
1.440
1.415
1.397
1.383
1.372
1.943
1.895
1.860
1.833
1.812
2.447
2.365
2.306
2.262
2.228
2.612
2.517
2.449
2.398
2.359
0.718
7
0.906
1.134
1.119
1.108
1.100
1.093
3.143
2.998
2.896
2.821
2.764
3.707
3.499
3.355
3.250
3.169
4.317
5.208
4.785
4.501
4.297
4.144
5.959
5.408
5.041
4.781
6.
0.711
8
0.706
0.703
0.700
0.896
0.889
0.883
0.879
4.029
3.833
3.690
3.581
8
9
10
4.587
10
0.697
0,695
0,694
0.692
0.691
0.876
0.873
0,870
0.868
1.363
1.356
1.350
1.345
1.341
2.201
2.179
2.160
2.145
2.131
2.328
2.303
2.282
2.264
2.249
2.718
2.681
2.650
2.624
2.602
3.106
3.055
3.012
2.977
2.947
3.497
3.428
3.372
3.326
3.286
4.025
3.930
11
1.088
1.796
4.437
11
12
13
1.083
1.079
1.076
1.782
1.771
1.761
1.753
4.318
4.221
12
13
3.852
3.787
3.733
14
4.140
14
15
0.866
1.074
4.073
15
1.337
1.333
1.330
1.328
1.325
1.746
1.740
1.734
1.729
1.725
2.120
2.110
2.101
2.093
2.086
2.583
2.567
2.552
2.539
2.528
3.252
3.222
3.197
3.174
3.153
0.690
16
17
0,865
0,863
0.862
0.861
0.860
1.071
1.069
1.067
1.066
1.064
2.235
2.224
2.214
2.205
2.197
2.921
2.898
2.878
2.861
2.845
3.686
3.646
4.015
3.965
16
17
0.689
0.688
0,688
0.687
18
3.610
3.922
3.883
3.850
18
3.579
3.552
19
19
20
20
0.859
0858
0.858
0,857
0.856
1.323
1.321
1.063
1.061
1.060
1.721
1.717
1.714
1.711
1.708
2.080
2.074
2.069
2.064
2.060
2.189
2.183
2.177
2.172
2.167
3.135
3.119
3.104
3.091
3.078
3.527
3.505
3.485
3.467
3.450
21
22
0.686
0.686
2.518
2.831
2.819
2,807
2.797
2.787
3.819
3.792
3.768
3.745
3.725
21
22
0.685
0.685
0.684
1.319
1.318
1.316
2.508
2.500
2.492
2.485
23
23
24
1.059
24
25
1.058
25
3.435
3.421
0856
0,855
0855
0.854
0.854
1.058
1.057
1.056
1.055
1.055
1.315
1.314
1.313
1.311
1.310
2.479
2.473
2.467
2.462
2.457
2.779
2.771
2.763
2.756
2.750
2.056
2.052
2.162
2.158
2.154
2.150
2.147
3.067
3.057
3.707
3.690
3.674
3.659
3.646
26
27
0,684
1.706
1.703
1.701
1.699
1.697
26
0.684
0.683
0.683
0.683
27
28
2.048
3.047
3.408
28
29
30
2.045
2.042
3.038
3.030
3.396
3.385
29
30
1.054
1.054
1.053
1.052
1.052
1.696
1.694
1.692
1.691
1.690
2.040
2.037
2.035
2.032
2.030
2.144
2.141
2.138
2.136
2.133
2.453
2.449
2.445
2.441
2.438
2.744
2.738
2.733
2.728
2.724
3.022
3.015
3.008
3.002
2.996
3.375
3.365
3.356
3.348
3.340
3.633
3.622
3.611
3.601
3.591
31
0.682
0,853
1.309
31
0.682
0.682
0.682
0.682
0.853
0,853
0.852
0.852
1.309
1.308
1.307
1.306
32
32
33
33
34
35
34
35
1.306
1.305
1.304
1.304
1.303
2.131
2.129
2.127
2.125
2.123
2.719
2.715
36
0.681
0.681
0.681
0.681
0.681
0,852
0.851
0.851
0.851
0,851
1.052
1.051
1.051
1.050
1.050
1.688
1.687
1.686
1.685
1.684
2.028
2.026
2.024
2.023
2.021
2.434
2.431
2.429
2.426
2.423
2.990
2.985
2.980
2.976
2.971
3.333
3.326
3.319
3.313
3.307
3.582
3.574
3.566
3.558
3.551
36
37
37
38
39
2.712
2.708
2.704
38
39
40
40
0.849
0.848
0.847
0.846
0,846
1.047
1.045
1.044
1.043
1.042
1.299
1.296
1.294
1.292
1.291
1.676
1.671
1.667
1.664
1.662
2.009
2.000
1.994
1.990
2.678
2.660
2.648
2.639
2.632
2.109
0,679
0.679
0.678
0.678
0.677
2.937
2.915
2.899
2.887
2.878
3.261
3.232
3.211
3.195
3.183
3.496
3.460
3.435
3.416
3.402
50
2.403
50
2.099
2.093
2.088
2.084
2.390
2.381
2.374
2.368
60
60
70
70
80
80
90
1.987
90
1.660
1.646
1.645
3.174
3.098
3.090
100
0.677
0.675
0,674
0,845
0.842
0,842
1.042
1.037
1.290
1.282
1.282
1.984
1.962
1.960
2.081
2.056
2.054
2.364
2.330
2.326
2.626
2.581
2.576
2.871
2.813
2,807
3.390 100
3.300 1000
3.291 z
1000
1.036
df
0.25
0.20
0.15
0.10
0.05
0.025
0.02
0.01
0.005
0.0025
0.001
0.0005
df
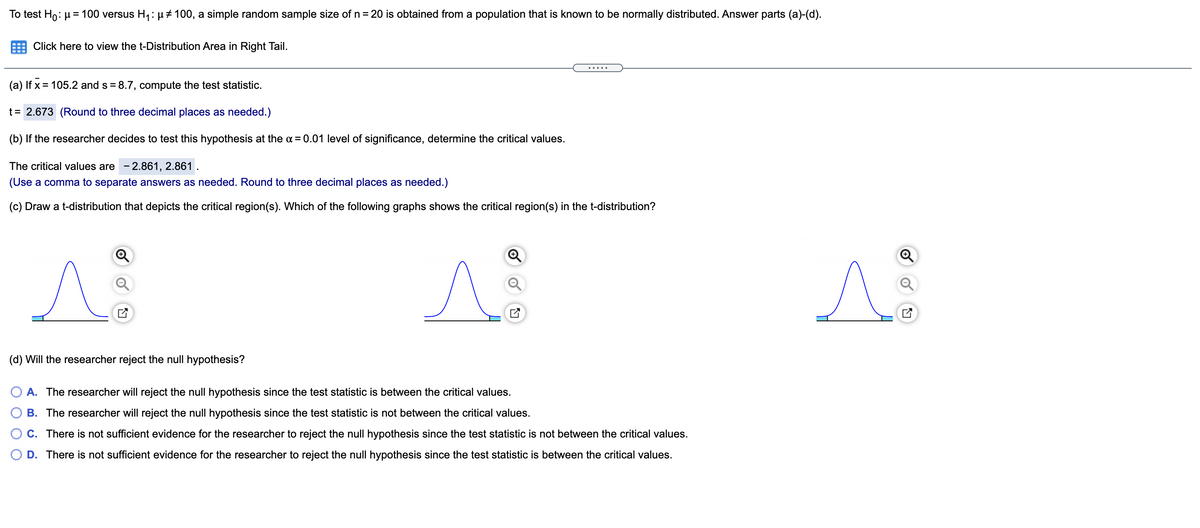
Transcribed Image Text:To test Ho: µ = 100 versus H,: H# 100, a simple random sample size of n= 20 is obtained from a population that is known to be normally distributed. Answer parts (a)-(d).
Click here to view the t-Distribution Area in Right Tail.
(a) If x = 105.2 and s = 8.7, compute the test statistic.
t= 2.673 (Round to three decimal places as needed.)
(b) If the researcher decides to test this hypothesis at the a = 0.01 level of significance, determine the critical values.
The critical values are - 2.861, 2.861 .
(Use a comma to separate answers as needed. Round to three decimal places as needed.)
(c) Draw a t-distribution that depicts the critical region(s). Which of the following graphs shows the critical region(s) in the t-distribution?
(d) Will the researcher reject the null hypothesis?
A. The researcher will reject the null hypothesis since the test statistic is between the critical values.
B. The researcher will reject the null hypothesis since the test statistic is not between the critical values.
C. There is not sufficient evidence for the researcher to reject the null hypothesis since the test statistic is not between the critical values.
D. There is not sufficient evidence for the researcher to reject the null hypothesis since the test statistic is between the critical values.
Expert Solution
This question has been solved!
Explore an expertly crafted, step-by-step solution for a thorough understanding of key concepts.

Step by step
Solved in 2 steps with 1 images

Recommended textbooks for you
MATLAB: An Introduction with Applications
Statistics
ISBN:
9781119256830
Author:
Amos Gilat
Publisher:
John Wiley & Sons Inc

Probability and Statistics for Engineering and th…
Statistics
ISBN:
9781305251809
Author:
Jay L. Devore
Publisher:
Cengage Learning

Statistics for The Behavioral Sciences (MindTap C…
Statistics
ISBN:
9781305504912
Author:
Frederick J Gravetter, Larry B. Wallnau
Publisher:
Cengage Learning
MATLAB: An Introduction with Applications
Statistics
ISBN:
9781119256830
Author:
Amos Gilat
Publisher:
John Wiley & Sons Inc
Probability and Statistics for Engineering and th…
Statistics
ISBN:
9781305251809
Author:
Jay L. Devore
Publisher:
Cengage Learning
Statistics for The Behavioral Sciences (MindTap C…
Statistics
ISBN:
9781305504912
Author:
Frederick J Gravetter, Larry B. Wallnau
Publisher:
Cengage Learning

Elementary Statistics: Picturing the World (7th E…
Statistics
ISBN:
9780134683416
Author:
Ron Larson, Betsy Farber
Publisher:
PEARSON

The Basic Practice of Statistics
Statistics
ISBN:
9781319042578
Author:
David S. Moore, William I. Notz, Michael A. Fligner
Publisher:
W. H. Freeman

Introduction to the Practice of Statistics
Statistics
ISBN:
9781319013387
Author:
David S. Moore, George P. McCabe, Bruce A. Craig
Publisher:
W. H. Freeman