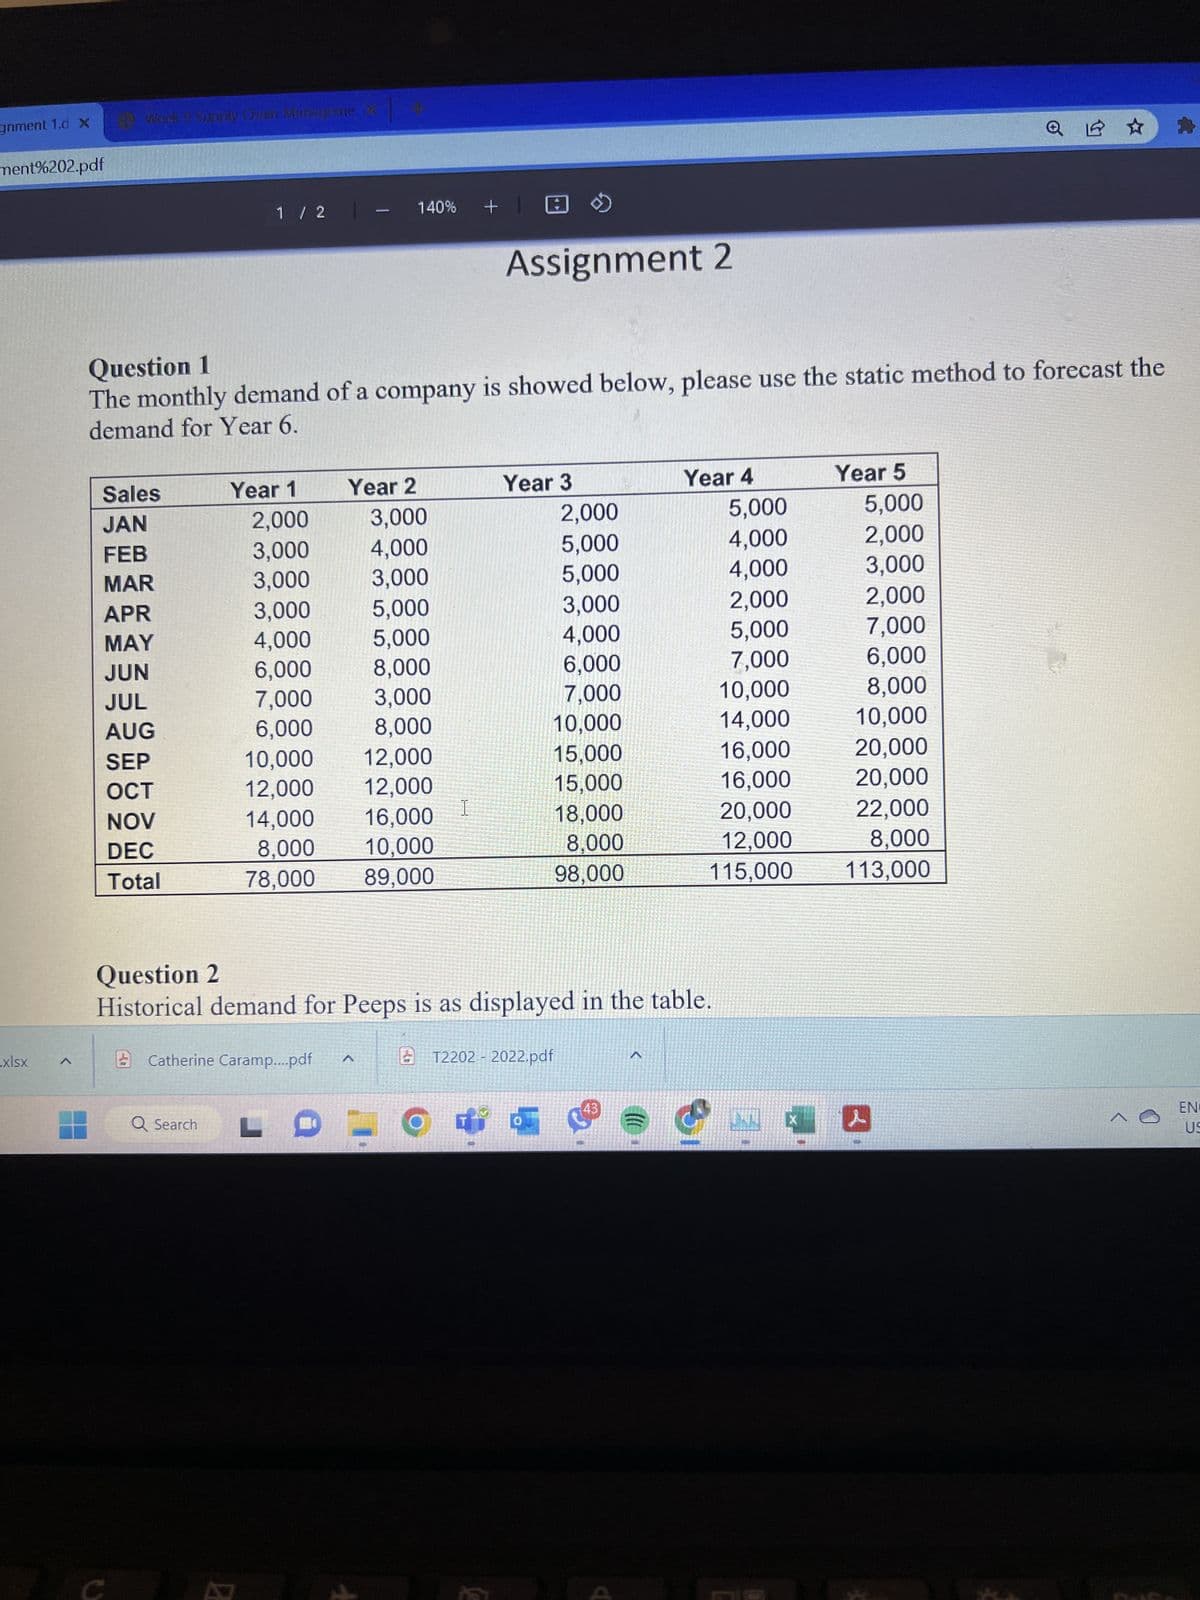
Question 1 The monthly demand of a company is showed below, please use the static method to forecast demand for Year 6. Sales JAN FEB MAR APR MAY JUN JUL AUG SEP OCT NOV DEC Total Year 1 Year 2 3,000 4,000 3,000 5,000 5,000 8,000 3,000 8,000 Assignment 2 2,000 3,000 3,000 3,000 4,000 6,000 7,000 6,000 10,000 12,000 12,000 12,000 14,000 16,000 8,000 10,000 78,000 89,000 Year 3 2,000 5,000 5,000 3,000 4,000 6,000 7,000 10,000 15,000 15,000 18,000 8,000 98,000 Year 4 5,000 4,000 4,000 2,000 5,000 7,000 10,000 14,000 Year 5 5,000 2,000 3,000 2,000 7,000 6,000 8,000 10,000 20,000 20,000 22,000 8,000 16,000 16,000 20,000 12,000 115,000 113,000
Question 1 The monthly demand of a company is showed below, please use the static method to forecast demand for Year 6. Sales JAN FEB MAR APR MAY JUN JUL AUG SEP OCT NOV DEC Total Year 1 Year 2 3,000 4,000 3,000 5,000 5,000 8,000 3,000 8,000 Assignment 2 2,000 3,000 3,000 3,000 4,000 6,000 7,000 6,000 10,000 12,000 12,000 12,000 14,000 16,000 8,000 10,000 78,000 89,000 Year 3 2,000 5,000 5,000 3,000 4,000 6,000 7,000 10,000 15,000 15,000 18,000 8,000 98,000 Year 4 5,000 4,000 4,000 2,000 5,000 7,000 10,000 14,000 Year 5 5,000 2,000 3,000 2,000 7,000 6,000 8,000 10,000 20,000 20,000 22,000 8,000 16,000 16,000 20,000 12,000 115,000 113,000

Practical Management Science
6th Edition
ISBN:9781337406659
Author:WINSTON, Wayne L.
Publisher:WINSTON, Wayne L.
Chapter2: Introduction To Spreadsheet Modeling
Section2.6: Estimating The Relationship Between Price And Demand
Problem 11P

Related questions
Question
Transcribed Image Text:gnment 1.d X
ment%202.pdf
.xlsx
HP Work & Supply Chain Marakane
Sales
JAN
FEB
MAR
APR
MAY
JUN
JUL
AUG
SEP
OCT
NOV
DEC
Total
-
1 / 2 -
Question 1
The monthly demand of a company is showed below, please use the static method to forecast the
demand for Year 6.
Year 1
Q Search
2,000
3,000
3,000
3,000
4,000
6,000
7,000
6,000
10,000
12,000
14,000
8,000
78,000
Catherine Caramp....pdf
Z
Year 2
140%
3,000
4,000
3,000
5,000
5,000
8,000
3,000
8,000
12,000
12,000
16,000
10,000
89,000
LDE
+ @
I
Assignment 2
Year 3
Question 2
Historical demand for Peeps is as displayed in the table.
2,000
5,000
5,000
3,000
4,000
6,000
7,000
10,000
15,000
15,000
18,000
8,000
98,000
T2202- 2022.pdf
0
Year 4
}})
5,000
4,000
4,000
2,000
5,000
7,000
10,000
14,000
16,000
16,000
20,000
12,000
115,000
!
Year 5
5,000
2,000
3,000
2,000
7,000
6,000
8,000
10,000
20,000
20,000
22,000
8,000
113,000
Q☆
l
EN
US
Expert Solution
This question has been solved!
Explore an expertly crafted, step-by-step solution for a thorough understanding of key concepts.

This is a popular solution!

Trending now
This is a popular solution!

Step by step
Solved in 2 steps with 3 images

Recommended textbooks for you
Practical Management Science
Operations Management
ISBN:
9781337406659
Author:
WINSTON, Wayne L.
Publisher:
Cengage,
Practical Management Science
Operations Management
ISBN:
9781337406659
Author:
WINSTON, Wayne L.
Publisher:
Cengage,