Question 1 The personnel manager of a large insurance company wishes to evaluate the effectiveness of four different sales training programs designed for new employees. A group of 32 recently hired college graduates are randomly assigned to the four programs so that there are 8 new recruits in each program. At the end of the month long training program, a standard exam is administered to all the 32 candidates and the scores are as follows. A 66 74 82 75 97 87 78 73 Sales Training Program Exam Scores B C 61 60 57 60 55 70 71 81 72 51 59 62 64 78 63 74 D 63 61 76 84 65 69 80 58 a) Use the one-way ANOVA to determine if there is any evidence of a significant difference in the four sales training programs. Use 5% significance level. b) Based on the results found in (a) above, if appropriate use the Tukey- Kramer procedure to determine, which of the programs are significantly different.
Question 1 The personnel manager of a large insurance company wishes to evaluate the effectiveness of four different sales training programs designed for new employees. A group of 32 recently hired college graduates are randomly assigned to the four programs so that there are 8 new recruits in each program. At the end of the month long training program, a standard exam is administered to all the 32 candidates and the scores are as follows. A 66 74 82 75 97 87 78 73 Sales Training Program Exam Scores B C 61 60 57 60 55 70 71 81 72 51 59 62 64 78 63 74 D 63 61 76 84 65 69 80 58 a) Use the one-way ANOVA to determine if there is any evidence of a significant difference in the four sales training programs. Use 5% significance level. b) Based on the results found in (a) above, if appropriate use the Tukey- Kramer procedure to determine, which of the programs are significantly different.

Algebra & Trigonometry with Analytic Geometry
13th Edition
ISBN:9781133382119
Author:Swokowski
Publisher:Swokowski
Chapter10: Sequences, Series, And Probability
Section10.8: Probability
Problem 32E

Related questions
Question
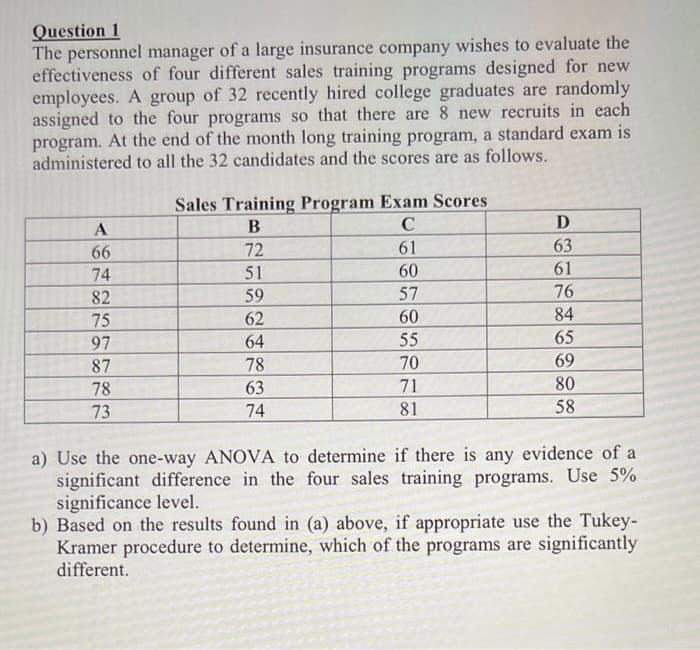
Transcribed Image Text:Question 1
The personnel manager of a large insurance company wishes to evaluate the
effectiveness of four different sales training programs designed for new
employees. A group of 32 recently hired college graduates are randomly
assigned to the four programs so that there are 8 new recruits in each
program. At the end of the month long training program, a standard exam is
administered to all the 32 candidates and the scores are as follows.
A
66
74
82
75
97
87
78
73
Sales Training Program Exam Scores
B
C
72
61
51
60
59
57
62
60
64
55
78
70
63
71
74
81
D
63
61
76
84
65
69
80
58
a) Use the one-way ANOVA to determine if there is any evidence of a
significant difference in the four sales training programs. Use 5%
significance level.
b) Based on the results found in (a) above, if appropriate use the Tukey-
Kramer procedure to determine, which of the programs are significantly
different.
Expert Solution
This question has been solved!
Explore an expertly crafted, step-by-step solution for a thorough understanding of key concepts.

Step by step
Solved in 3 steps with 2 images

Recommended textbooks for you
Algebra & Trigonometry with Analytic Geometry
Algebra
ISBN:
9781133382119
Author:
Swokowski
Publisher:
Cengage
Algebra & Trigonometry with Analytic Geometry
Algebra
ISBN:
9781133382119
Author:
Swokowski
Publisher:
Cengage