Question 13 (chap 10) A sociologist claims that the age distribution for the residents of a certain city is different than it was 10 years ago. The distribution of ages 10 years ago is shown in the table below.You randomly select 400 residents and record the age of each.The survey results are shown in the table. At a = 0.05 perform a chi-square goodness-of-fit test to test whether the distribution has changed. a. Verify that the expected frequency is at least 5 for each category. b. Identify the claimed distribution and state Ho and Ha c. Specify the level of significance a. d. Determine the degrees of freedom.. e. Determine the critical value and the rejection region. f. Find the chi-square test statistic. Sketch a graph. g. Decide whether to reject the null hypothesis. h. Interpret the decision in the context of the original claim. For Q? 13 0-9 16% 76 10-19 20% 84 20-29 8% 30 30-39 14% 60 40-49 15% 54 50-59 12% 40 60-69 10% 42 70+ 5% 14
Question 13 (chap 10) A sociologist claims that the age distribution for the residents of a certain city is different than it was 10 years ago. The distribution of ages 10 years ago is shown in the table below.You randomly select 400 residents and record the age of each.The survey results are shown in the table. At a = 0.05 perform a chi-square goodness-of-fit test to test whether the distribution has changed. a. Verify that the expected frequency is at least 5 for each category. b. Identify the claimed distribution and state Ho and Ha c. Specify the level of significance a. d. Determine the degrees of freedom.. e. Determine the critical value and the rejection region. f. Find the chi-square test statistic. Sketch a graph. g. Decide whether to reject the null hypothesis. h. Interpret the decision in the context of the original claim. For Q? 13 0-9 16% 76 10-19 20% 84 20-29 8% 30 30-39 14% 60 40-49 15% 54 50-59 12% 40 60-69 10% 42 70+ 5% 14

Algebra & Trigonometry with Analytic Geometry
13th Edition
ISBN:9781133382119
Author:Swokowski
Publisher:Swokowski
Chapter7: Analytic Trigonometry
Section7.2: Trigonometric Equations
Problem 100E

Related questions
Question
100%
answer in detail
D E) F)
Transcribed Image Text:Question 13 (chap 10)
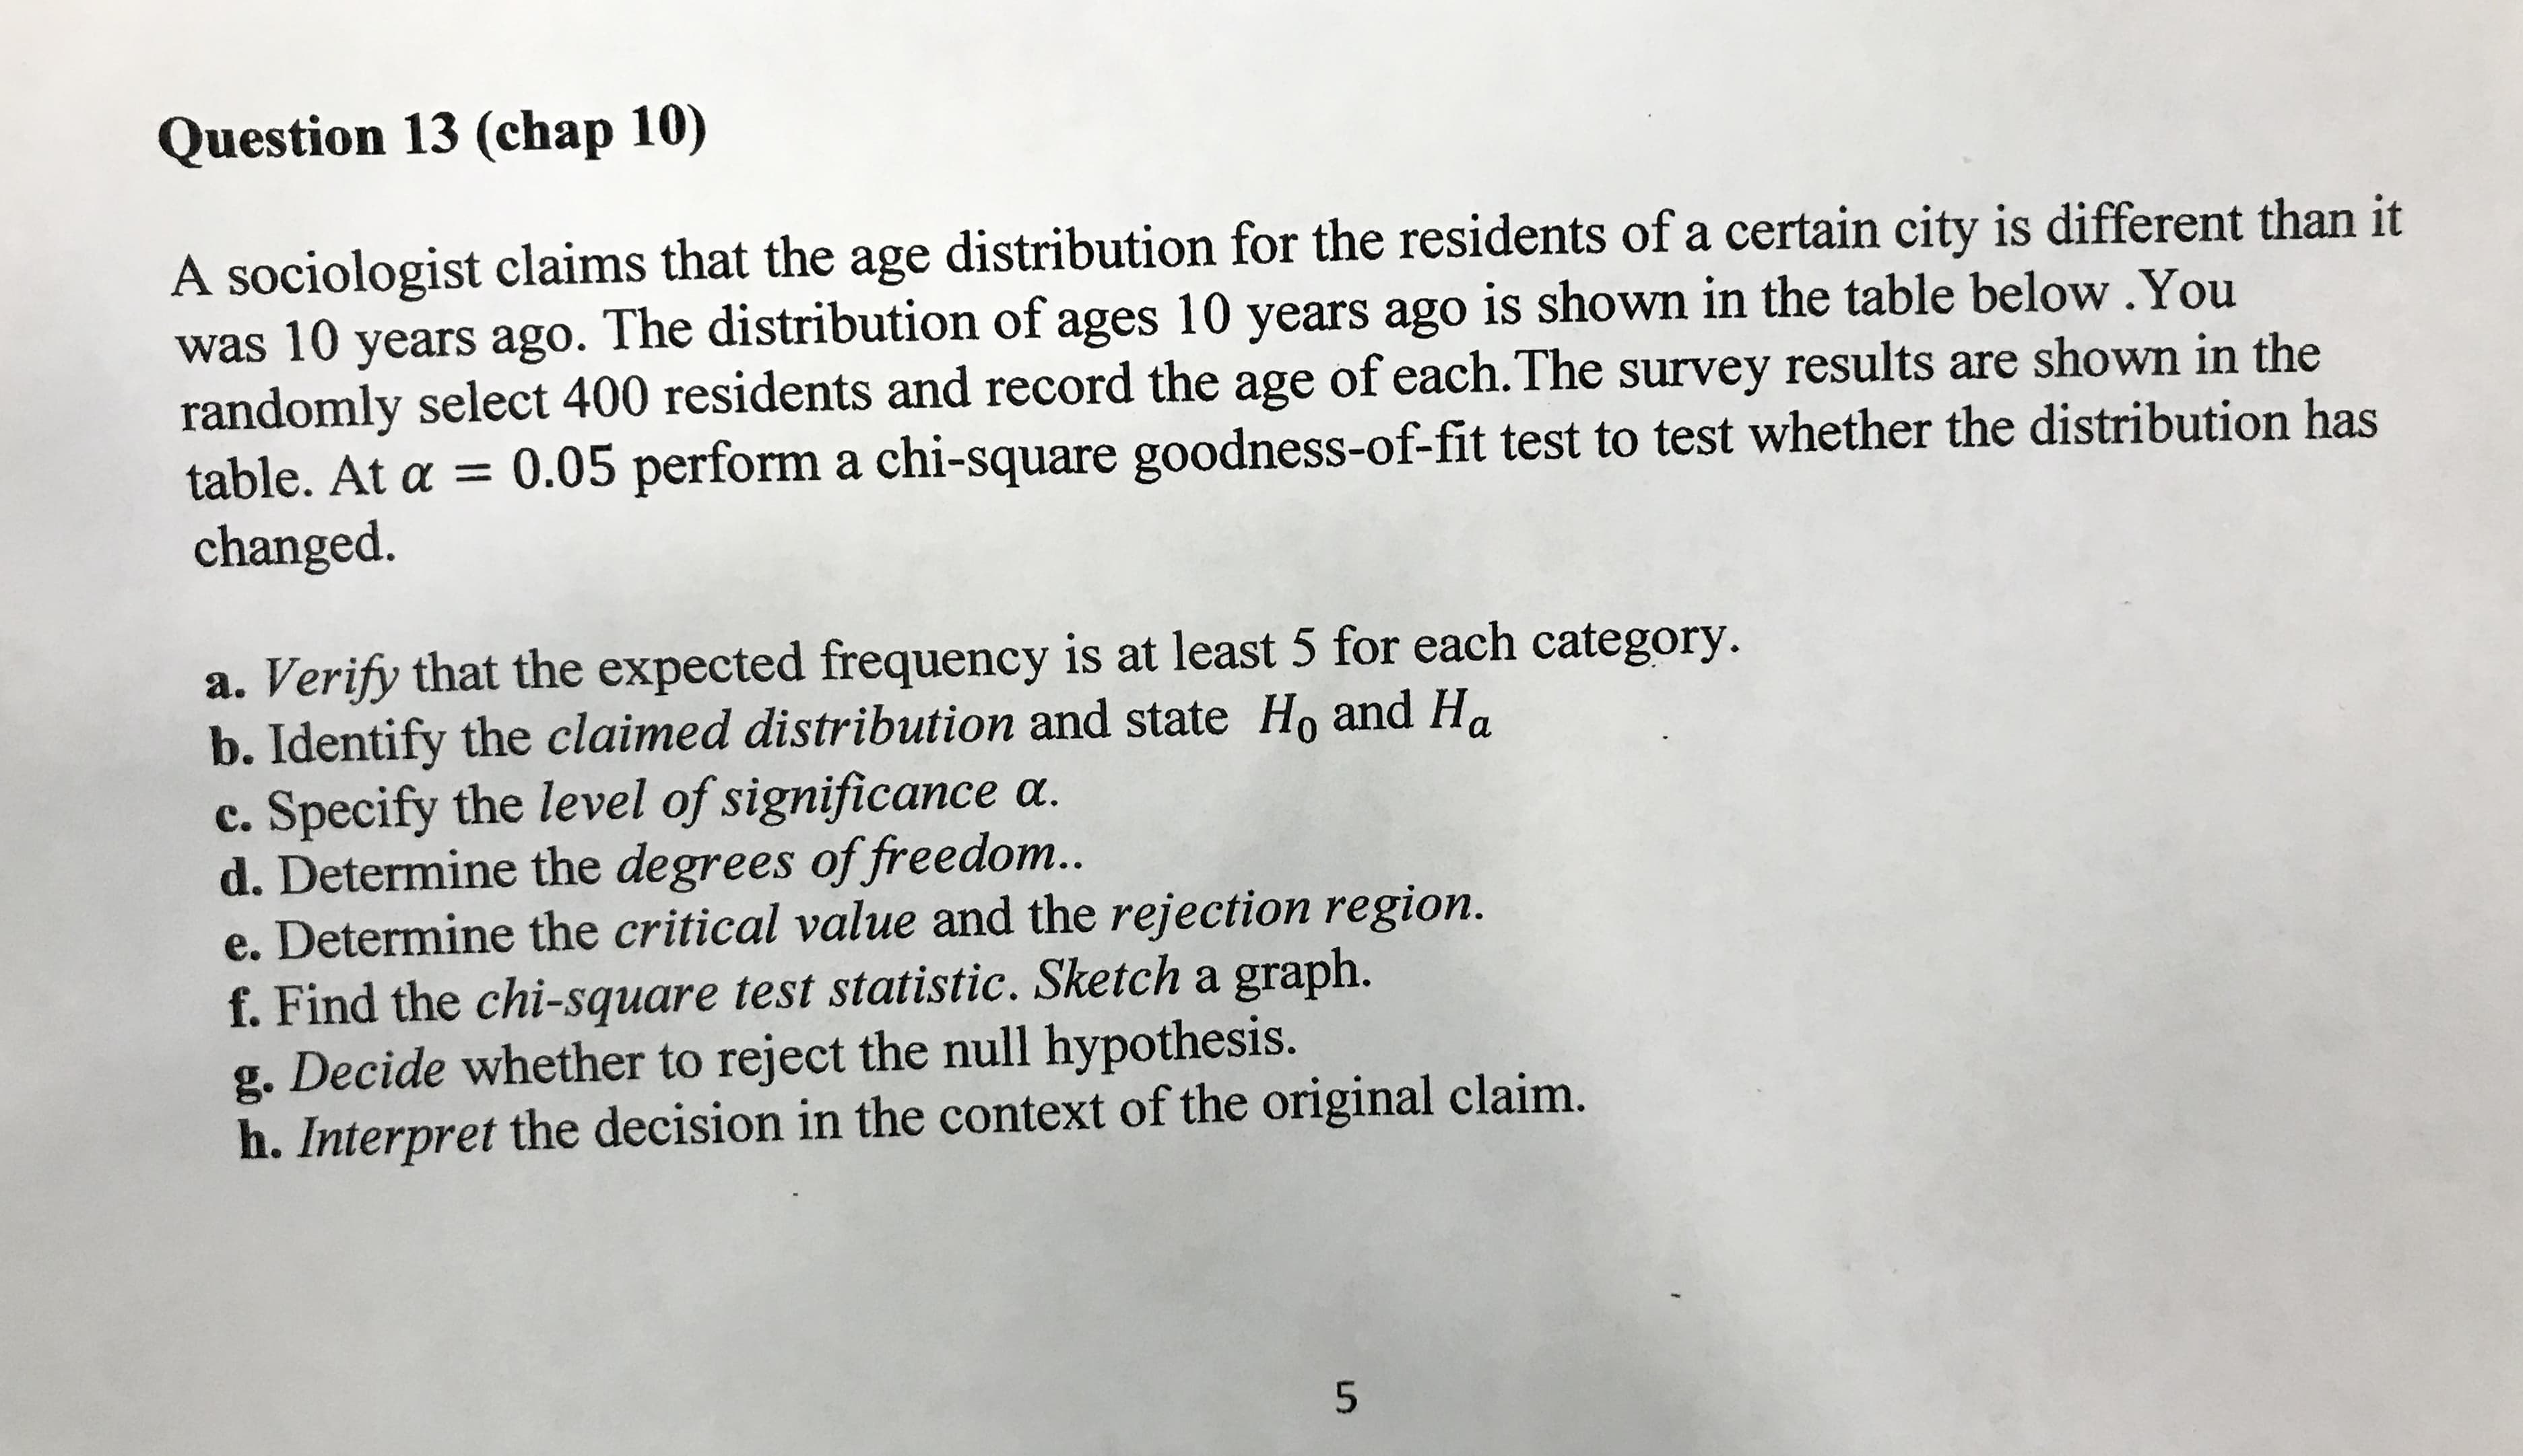
A sociologist claims that the age distribution for the residents of a certain city is different than it
was 10 years ago. The distribution of ages 10 years ago is shown in the table below.You
randomly select 400 residents and record the age of each.The survey results are shown in the
table. At a = 0.05 perform a chi-square goodness-of-fit test to test whether the distribution has
changed.
a. Verify that the expected frequency is at least 5 for each category.
b. Identify the claimed distribution and state Ho and Ha
c. Specify the level of significance a.
d. Determine the degrees of freedom..
e. Determine the critical value and the rejection region.
f. Find the chi-square test statistic. Sketch a graph.
g. Decide whether to reject the null hypothesis.
h. Interpret the decision in the context of the original claim.
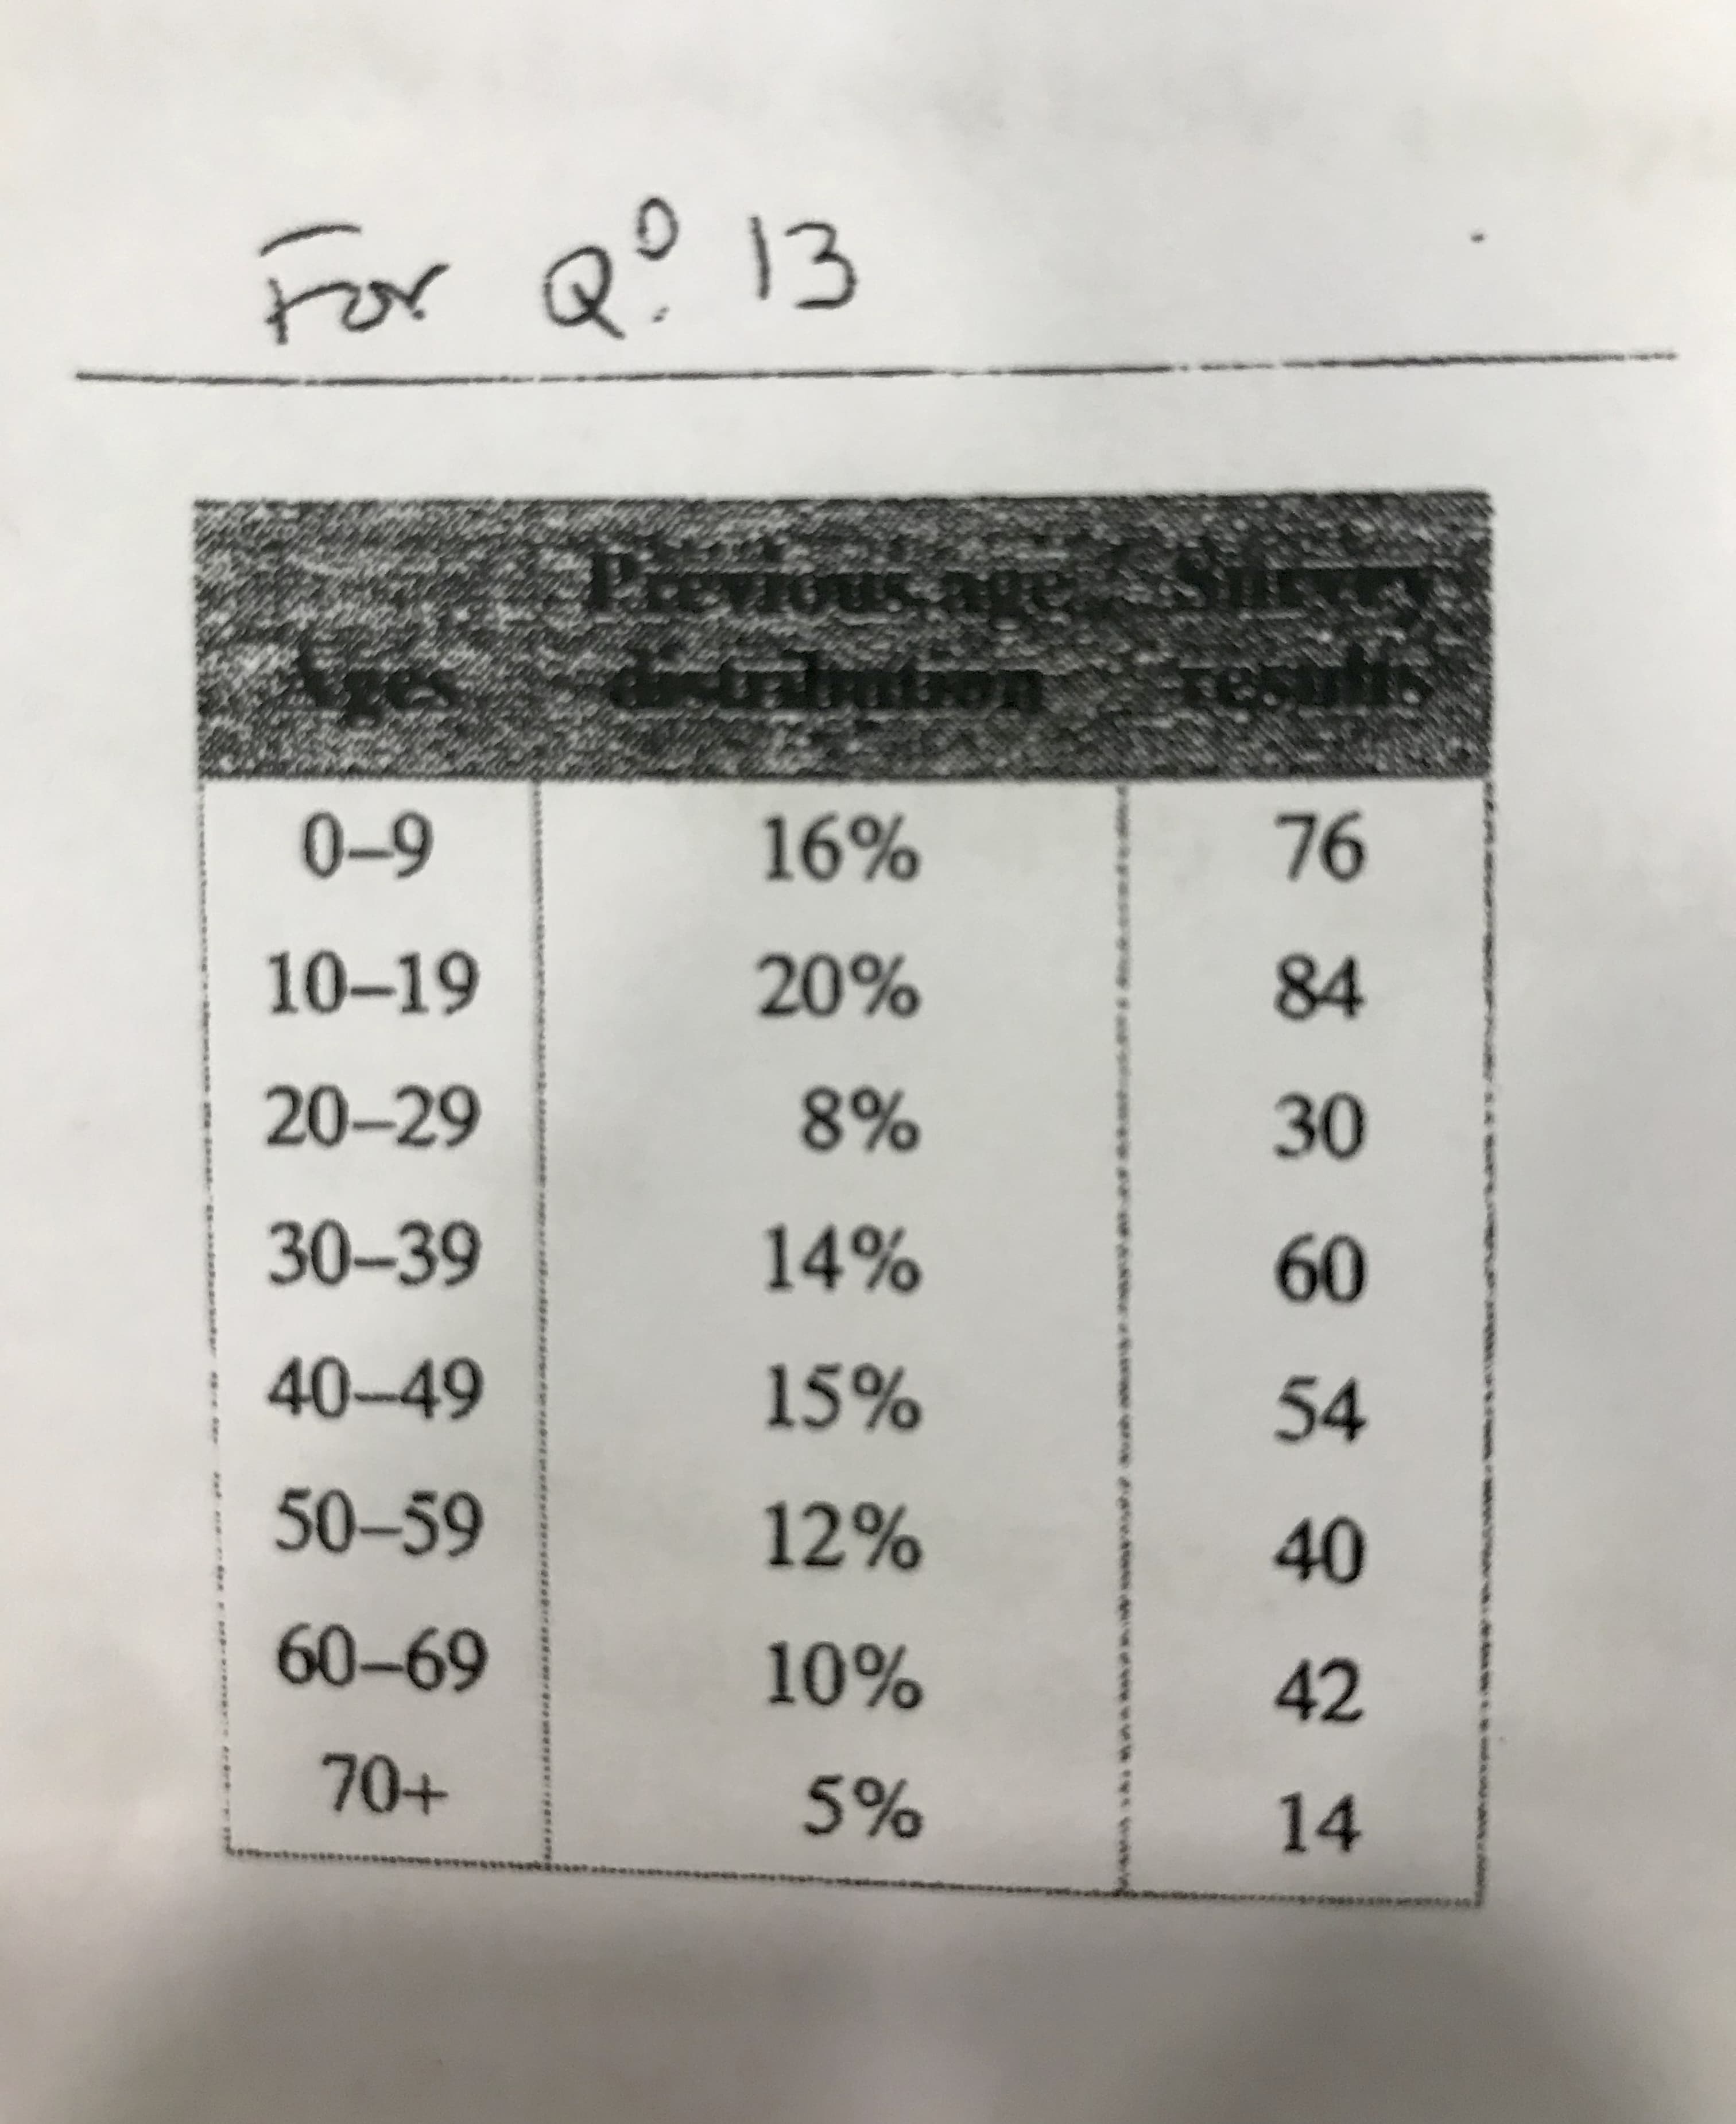
Transcribed Image Text:For Q? 13
0-9
16%
76
10-19
20%
84
20-29
8%
30
30-39
14%
60
40-49
15%
54
50-59
12%
40
60-69
10%
42
70+
5%
14
Expert Solution
This question has been solved!
Explore an expertly crafted, step-by-step solution for a thorough understanding of key concepts.

This is a popular solution!

Trending now
This is a popular solution!

Step by step
Solved in 3 steps with 3 images

Knowledge Booster


Learn more about
Need a deep-dive on the concept behind this application? Look no further. Learn more about this topic, statistics and related others by exploring similar questions and additional content below.Recommended textbooks for you
Algebra & Trigonometry with Analytic Geometry
Algebra
ISBN:
9781133382119
Author:
Swokowski
Publisher:
Cengage

Trigonometry (MindTap Course List)
Trigonometry
ISBN:
9781305652224
Author:
Charles P. McKeague, Mark D. Turner
Publisher:
Cengage Learning
Algebra & Trigonometry with Analytic Geometry
Algebra
ISBN:
9781133382119
Author:
Swokowski
Publisher:
Cengage
Trigonometry (MindTap Course List)
Trigonometry
ISBN:
9781305652224
Author:
Charles P. McKeague, Mark D. Turner
Publisher:
Cengage Learning