QUESTION 19 The pie chart shows the amount of time each day that Gary spends on various activities. If this information were displayed using a bar graph with hour of the bar for work? Time Spent on Daily Activities 14% 8% 40% Work Sleep TY
QUESTION 19 The pie chart shows the amount of time each day that Gary spends on various activities. If this information were displayed using a bar graph with hour of the bar for work? Time Spent on Daily Activities 14% 8% 40% Work Sleep TY

ChapterP: Prerequisites
Section: Chapter Questions
Problem 14PS

Related questions
Question
Transcribed Image Text:Question Completion Status:
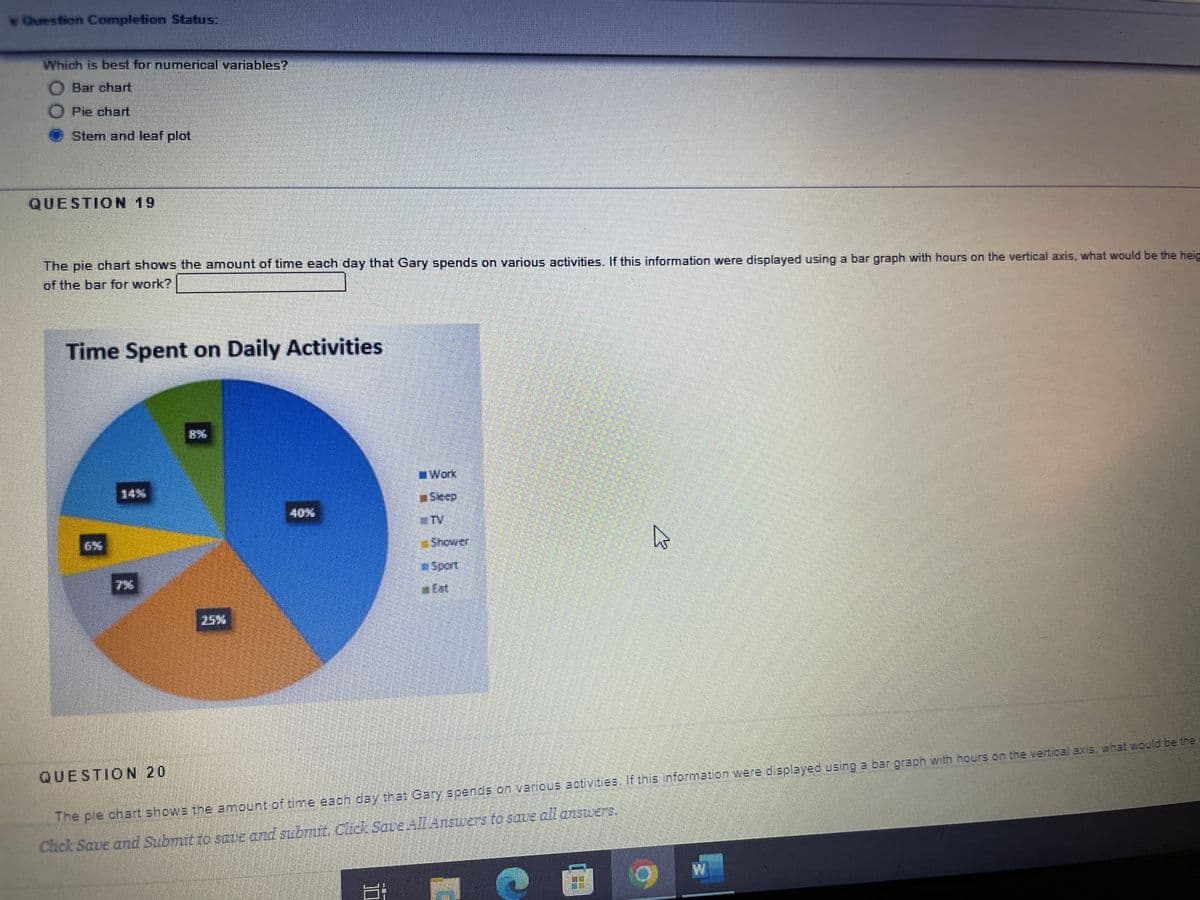
Which is best for numerical variables?
Bar chart
Pie chart
Stem and leaf plot
QUESTION 19
The pie chart shows the amount of time each day that Gary spends on various activities. If this information were displayed using a bar graph with hours on the vertical axis, what would be the heig
of the bar for work?
Time Spent on Daily Activities
QUESTION 20
Work
Sleep
TV
Sport
TEAT
X
The pie chart shows the amount of time each day that Gary spends on various activities. If this information were displayed using a bar graph with hours on the vertical axis, what would be the
Chick Save and Submit to save and submit. Click Save All Answers to save all answers.
ES
Expert Solution
This question has been solved!
Explore an expertly crafted, step-by-step solution for a thorough understanding of key concepts.

Step by step
Solved in 2 steps

Recommended textbooks for you

Holt Mcdougal Larson Pre-algebra: Student Edition…
Algebra
ISBN:
9780547587776
Author:
HOLT MCDOUGAL
Publisher:
HOLT MCDOUGAL

College Algebra (MindTap Course List)
Algebra
ISBN:
9781305652231
Author:
R. David Gustafson, Jeff Hughes
Publisher:
Cengage Learning
Holt Mcdougal Larson Pre-algebra: Student Edition…
Algebra
ISBN:
9780547587776
Author:
HOLT MCDOUGAL
Publisher:
HOLT MCDOUGAL
College Algebra (MindTap Course List)
Algebra
ISBN:
9781305652231
Author:
R. David Gustafson, Jeff Hughes
Publisher:
Cengage Learning

Glencoe Algebra 1, Student Edition, 9780079039897…
Algebra
ISBN:
9780079039897
Author:
Carter
Publisher:
McGraw Hill

Big Ideas Math A Bridge To Success Algebra 1: Stu…
Algebra
ISBN:
9781680331141
Author:
HOUGHTON MIFFLIN HARCOURT
Publisher:
Houghton Mifflin Harcourt