Question 2 A natural wellness and beauty company claims that, on average, their new product. lowers blood pressure. A group of six consumers was randomly selected and their systolic blood pressure was measured before and one month after they started takin. the supplement. Results are shown in the table below. The "before" value is matched the "after" value, and the difference should be calculated. Suppose that it is known that such differences have approximately bell-shaped distribution. Part I. Suppose that differences are d Before After. Find the sample mean e and sample standard deviations of the differences. Step 1. Fill in the column "d= Before - After " of the table. Then, calculated and fill in the cell below the table. Step 2. Using d, fill in the last two columns of the table. Consumer Before 1 2 3 4 5 125 132 131 130 162 After d 123 131 134 130 158 d-d d- 2
Question 2 A natural wellness and beauty company claims that, on average, their new product. lowers blood pressure. A group of six consumers was randomly selected and their systolic blood pressure was measured before and one month after they started takin. the supplement. Results are shown in the table below. The "before" value is matched the "after" value, and the difference should be calculated. Suppose that it is known that such differences have approximately bell-shaped distribution. Part I. Suppose that differences are d Before After. Find the sample mean e and sample standard deviations of the differences. Step 1. Fill in the column "d= Before - After " of the table. Then, calculated and fill in the cell below the table. Step 2. Using d, fill in the last two columns of the table. Consumer Before 1 2 3 4 5 125 132 131 130 162 After d 123 131 134 130 158 d-d d- 2

MATLAB: An Introduction with Applications
6th Edition
ISBN:9781119256830
Author:Amos Gilat
Publisher:Amos Gilat
Chapter1: Starting With Matlab
Section: Chapter Questions
Problem 1P

Related questions
Question
Transcribed Image Text:Question 2
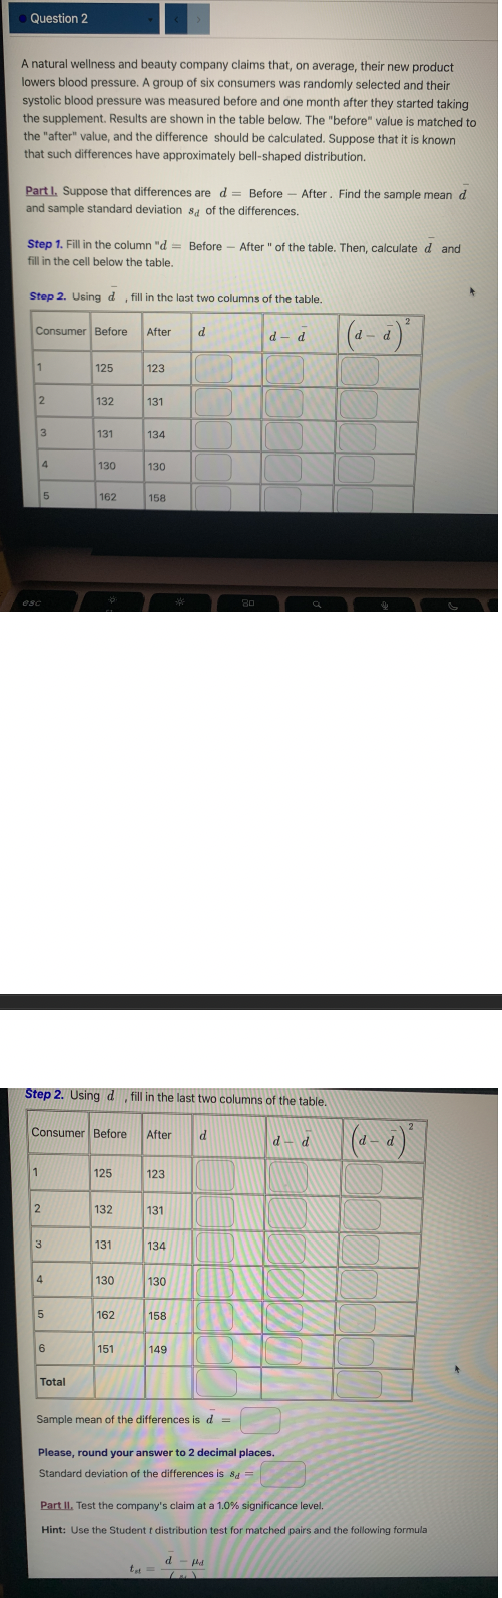
A natural wellness and beauty company claims that, on average, their new product
lowers blood pressure. A group of six consumers was randomly selected and their
systolic blood pressure was measured before and one month after they started taking
the supplement. Results are shown in the table below. The "before" value is matched to
the "after" value, and the difference should be calculated. Suppose that it is known
that such differences have approximately bell-shaped distribution.
Part I. Suppose that differences are d = Before After. Find the sample mean d
and sample standard deviations of the differences.
Step 1. Fill in the column "d= Before After " of the table. Then, calculate d and
fill in the cell below the table.
Step 2. Using d, fill in the last two columns of the table.
Consumer Before After d
1
2
3
esc
4
1
2
5
3
4
5
125
6
132
Total
131
130
162
Consumer Before After d
Step 2. Using d, fill in the last two columns of the table.
125
132
131
130
123
162
131
151
134
130
158
123
131
134
130
158
***
149
-
Sample mean of the differences is d =
tt =
80
d-d
d-fd
Please, round your answer to 2 decimal places.
Standard deviation of the differences is sd =
d-d
(d-d
2
Part II. Test the company's claim at a 1.0% significance level.
Hint: Use the Student t distribution test for matched pairs and the following formula
(d-à)²
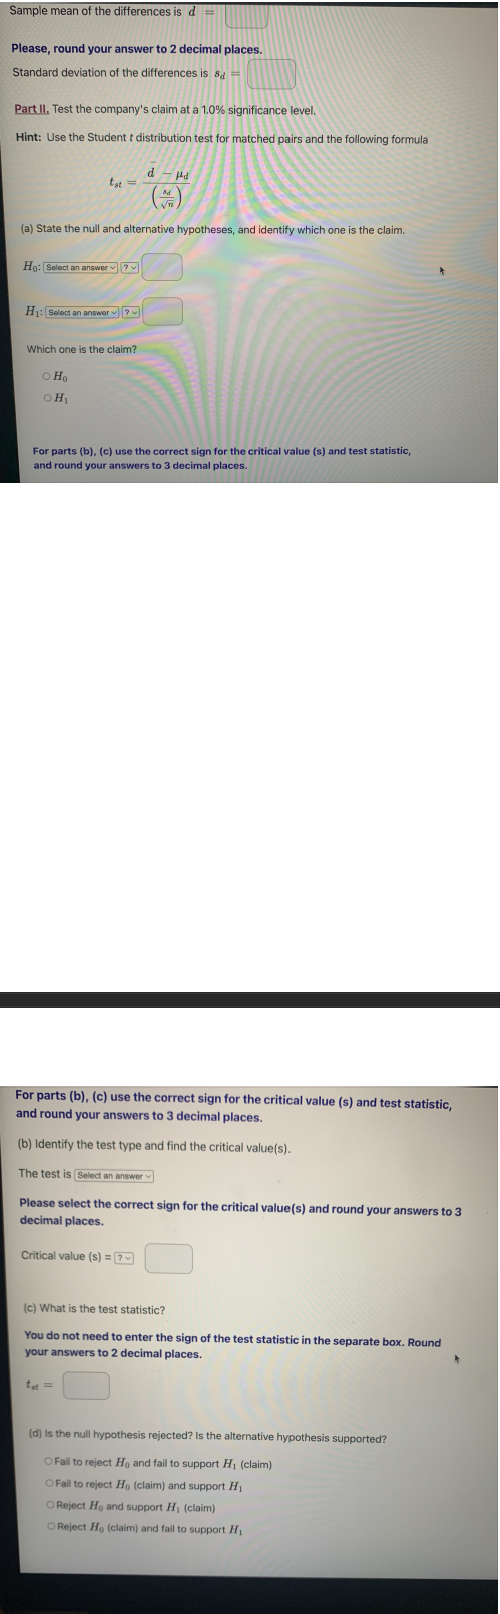
Transcribed Image Text:Sample mean of the differences is d =
Please, round your answer to 2 decimal places.
Standard deviation of the differences is 8 =
Part II. Test the company's claim at a 1.0% significance level.
Hint: Use the Student t distribution test for matched pairs and the following formula
tat =
(a) State the null and alternative hypotheses, and identify which one is the claim.
Ho: Select an answer?
H₁: Select an answer?
Which one is the claim?
O Ho
OH,
d-d
Bd
For parts (b), (c) use the correct sign for the critical value (s) and test statistic,
and round your answers to 3 decimal places.
For parts (b), (c) use the correct sign for the critical value (s) and test statistic,
and round your answers to 3 decimal places.
(b) Identify the test type and find the critical value(s).
The test is Select an answer
Please select the correct sign for the critical value(s) and round your answers to 3
decimal places.
Critical value (s) = ?
tst=
(c) What is the test statistic?
You do not need to enter the sign of the test statistic in the separate box. Round
your answers to 2 decimal places.
(d) is the null hypothesis rejected? Is the alternative hypothesis supported?
O Fail to reject Ho and fail to support H₁ (claim)
O Fail to reject Ho (claim) and support H₁
O Reject Ho and support H₁ (claim)
O Reject Ho (claim) and fail to support H₁
Expert Solution
This question has been solved!
Explore an expertly crafted, step-by-step solution for a thorough understanding of key concepts.

Step by step
Solved in 4 steps with 7 images

Recommended textbooks for you
MATLAB: An Introduction with Applications
Statistics
ISBN:
9781119256830
Author:
Amos Gilat
Publisher:
John Wiley & Sons Inc

Probability and Statistics for Engineering and th…
Statistics
ISBN:
9781305251809
Author:
Jay L. Devore
Publisher:
Cengage Learning

Statistics for The Behavioral Sciences (MindTap C…
Statistics
ISBN:
9781305504912
Author:
Frederick J Gravetter, Larry B. Wallnau
Publisher:
Cengage Learning
MATLAB: An Introduction with Applications
Statistics
ISBN:
9781119256830
Author:
Amos Gilat
Publisher:
John Wiley & Sons Inc
Probability and Statistics for Engineering and th…
Statistics
ISBN:
9781305251809
Author:
Jay L. Devore
Publisher:
Cengage Learning
Statistics for The Behavioral Sciences (MindTap C…
Statistics
ISBN:
9781305504912
Author:
Frederick J Gravetter, Larry B. Wallnau
Publisher:
Cengage Learning

Elementary Statistics: Picturing the World (7th E…
Statistics
ISBN:
9780134683416
Author:
Ron Larson, Betsy Farber
Publisher:
PEARSON

The Basic Practice of Statistics
Statistics
ISBN:
9781319042578
Author:
David S. Moore, William I. Notz, Michael A. Fligner
Publisher:
W. H. Freeman

Introduction to the Practice of Statistics
Statistics
ISBN:
9781319013387
Author:
David S. Moore, George P. McCabe, Bruce A. Craig
Publisher:
W. H. Freeman