QUESTION 2 A study is being carried out to see any differences in life satisfaction between young, middle- aged, and older men and women. A life satisfaction questionnaire is given to each participant in the research. A high degree of life satisfaction is indicated by a high score on the questionnaire. The results are listed in the table below. Adult Categories Middle Older Gender Young Men 10 Women 11 10 The MINITAB output for the above data is as follows. Analysis of Variance DF 1 adult categories 2 Source MS 6.000 8.667 C 0.225 4.334 0.187 gender 6.000 2 4.000 27.333 Error Total 5 Assume all the assumptions of ANOVA are met, answer the following questions. c) Using the given data, show that SST is 27.333
QUESTION 2 A study is being carried out to see any differences in life satisfaction between young, middle- aged, and older men and women. A life satisfaction questionnaire is given to each participant in the research. A high degree of life satisfaction is indicated by a high score on the questionnaire. The results are listed in the table below. Adult Categories Middle Older Gender Young Men 10 Women 11 10 The MINITAB output for the above data is as follows. Analysis of Variance DF 1 adult categories 2 Source MS 6.000 8.667 C 0.225 4.334 0.187 gender 6.000 2 4.000 27.333 Error Total 5 Assume all the assumptions of ANOVA are met, answer the following questions. c) Using the given data, show that SST is 27.333

Glencoe Algebra 1, Student Edition, 9780079039897, 0079039898, 2018
18th Edition
ISBN:9780079039897
Author:Carter
Publisher:Carter
Chapter4: Equations Of Linear Functions
Section4.5: Correlation And Causation
Problem 11PPS

Related questions
Question
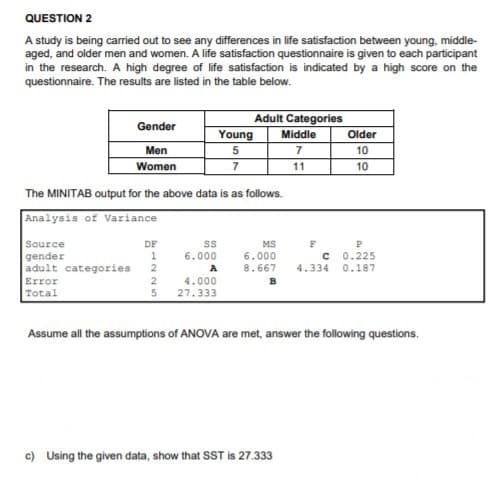
Transcribed Image Text:QUESTION 2
A study is being carried out to see any differences in life satisfaction between young, middle-
aged, and older men and women. A life satisfaction questionnaire is given to each participant
in the research. A high degree of life satisfaction is indicated by a high score on the
questionnaire. The results are listed in the table below.
Adult Categories
Gender
Young
Middle
Older
Men
7
10
Women
11
10
The MINITAB output for the above data is as follows.
Analysis of Variance
Source
gender
adult categories
DF
MS
6.000
8.667
C 0.225
4.334 0.187
6.000
A
4.000
27.333
Error
B
Total
5
Assume all the assumptions of ANOVA are met, answer the following questions.
c) Using the given data, show that SST is 27.333
Expert Solution
This question has been solved!
Explore an expertly crafted, step-by-step solution for a thorough understanding of key concepts.

Step by step
Solved in 2 steps

Recommended textbooks for you
Glencoe Algebra 1, Student Edition, 9780079039897…
Algebra
ISBN:
9780079039897
Author:
Carter
Publisher:
McGraw Hill

Big Ideas Math A Bridge To Success Algebra 1: Stu…
Algebra
ISBN:
9781680331141
Author:
HOUGHTON MIFFLIN HARCOURT
Publisher:
Houghton Mifflin Harcourt

Holt Mcdougal Larson Pre-algebra: Student Edition…
Algebra
ISBN:
9780547587776
Author:
HOLT MCDOUGAL
Publisher:
HOLT MCDOUGAL
Glencoe Algebra 1, Student Edition, 9780079039897…
Algebra
ISBN:
9780079039897
Author:
Carter
Publisher:
McGraw Hill
Big Ideas Math A Bridge To Success Algebra 1: Stu…
Algebra
ISBN:
9781680331141
Author:
HOUGHTON MIFFLIN HARCOURT
Publisher:
Houghton Mifflin Harcourt
Holt Mcdougal Larson Pre-algebra: Student Edition…
Algebra
ISBN:
9780547587776
Author:
HOLT MCDOUGAL
Publisher:
HOLT MCDOUGAL