QUESTION 2 Banila Co. selected 1,000 young adults at random and surveyed them to determine a relationship between the monthly spending on skincare products and the age of the customers. The survey findings are reported in the table below. Monthly spending ($) Age 20s 75 91 30s $0.00 - 549.99 $50.00 - $99.99 29 83 90 113 $100.00 - $149.99 $150.00 - $199.99 $200.00 - $249.99 $250.00 or more Total customers 89 128 63 34 465 159 46 535 a. What is the probability that a customer is in his/her 20s? b. What is the probability that a customer spends at least $150.00 and is in his/her 30s? c. What is the probability that a customer spends at least $150.00 or is in his/her 30s?
QUESTION 2 Banila Co. selected 1,000 young adults at random and surveyed them to determine a relationship between the monthly spending on skincare products and the age of the customers. The survey findings are reported in the table below. Monthly spending ($) Age 20s 75 91 30s $0.00 - 549.99 $50.00 - $99.99 29 83 90 113 $100.00 - $149.99 $150.00 - $199.99 $200.00 - $249.99 $250.00 or more Total customers 89 128 63 34 465 159 46 535 a. What is the probability that a customer is in his/her 20s? b. What is the probability that a customer spends at least $150.00 and is in his/her 30s? c. What is the probability that a customer spends at least $150.00 or is in his/her 30s?

Algebra & Trigonometry with Analytic Geometry
13th Edition
ISBN:9781133382119
Author:Swokowski
Publisher:Swokowski
Chapter4: Polynomial And Rational Functions
Section4.6: Variation
Problem 16E

Related questions

Question
Transcribed Image Text:Document1 - Word
困
File
Home
Insert
Design
Layout
References
Mailings
Review
View
Acrobat
O Tell me what you want to do.
& Share
O Find -
X Cut
e Copy
Calibri (Body) - 11
A A Aa -
AaBbCcDd AaBbCcDd AaBbC AABBCCD AaB AaBbCcD AaBbCcDd AaBbCcDd
ac Replace
A Select -
Paste
I U - abe Xx, x A - ay - A
A - H -
I Normal
1 No Spac. Heading 1 Heading 2
Subtle Em.. Emphasis
Create and Share Request
Title
Subtitle
* Format Painter
Adobe PDF
Signatures
Clipboard
Font
Paragraph
Styles
Editing
Adobe Acrobat
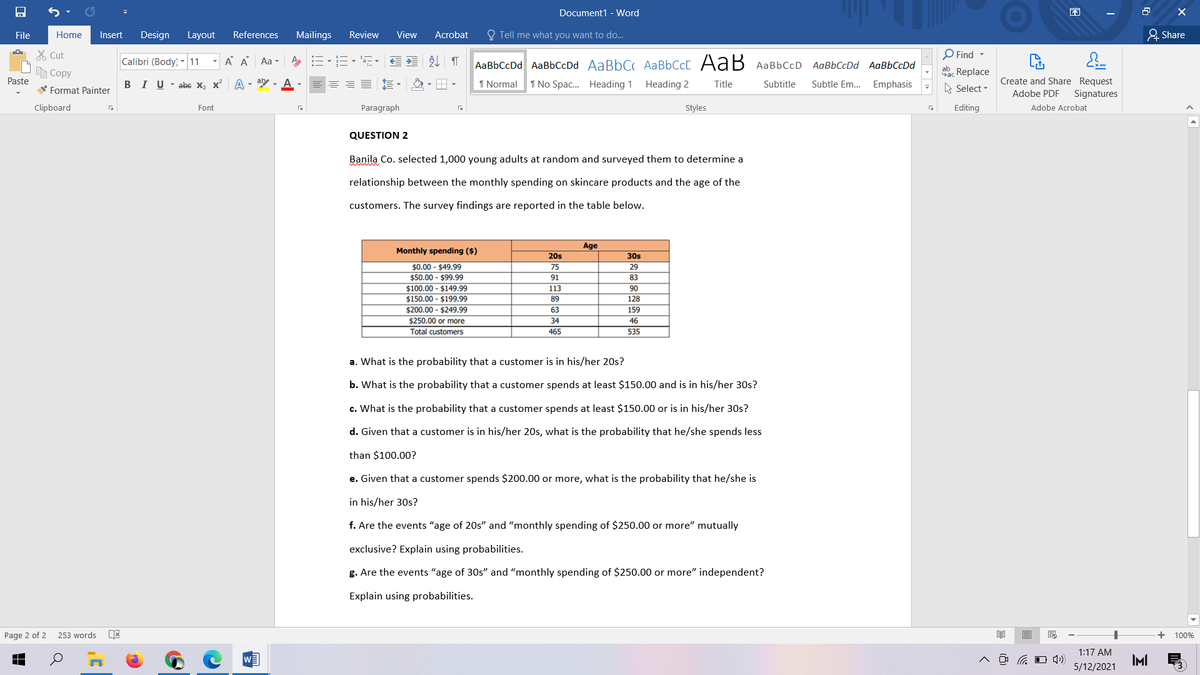
QUESTION 2
Banila Co. selected 1,000 young adults at random and surveyed them to determine a
relationship between the monthly spending on skincare products and the age of the
customers. The survey findings are reported in the table below.
Age
Monthly spending ($)
20s
30s
75
$0.00 - $49.99
$50.00 - $99.99
$100.00 - $149.99
$150.00 - $199.99
$200.00 - $249.99
29
91
83
113
90
89
128
63
159
$250.00 or more
34
46
Total customers
465
535
a. What is the probability that a customer is in his/her 20s?
b. What is the probability that a customer spends at least $150.00 and is in his/her 30s?
c. What is the probability that a customer spends at least $150.00 or is in his/her 30s?
d. Given that a customer is in his/her 20s, what is the probability that he/she spends less
than $100.00?
e. Given that a customer spends $200.00 or more, what is the probability that he/she is
in his/her 30s?
f. Are the events "age of 20s" and "monthly spending of $250.00 or more" mutually
exclusive? Explain using probabilities.
g. Are the events "age of 30s" and "monthly spending of $250.00 or more" independent?
Explain using probabilities.
Page 2 of 2
253 words
100%
1:17 AM
IMI
5/12/2021
Transcribed Image Text:Document1 - Word
困
File
Home
Insert
Design
Layout
References
Mailings
Review
View
Acrobat
O Tell me what you want to do.
& Share
X Cut
O Find -
Calibri (Body) - 11
A A Aa -
AaBbCcDd AaBbCcDd AaBbC AABBCCC AaB AaBbCcD AaBbCcDd AaBbCcDd
ab
自Copy
Sac Replace
A Select -
Create and Share Request
Signatures
Paste
I U - abe x, x A - ay - A
I Normal
1 No Spac. Heading 1 Heading 2
Title
Subtitle
Subtle Em.. Emphasis
V Format Painter
Adobe PDF
Clipboard
Font
Paragraph
Styles
Editing
Adobe Acrobat
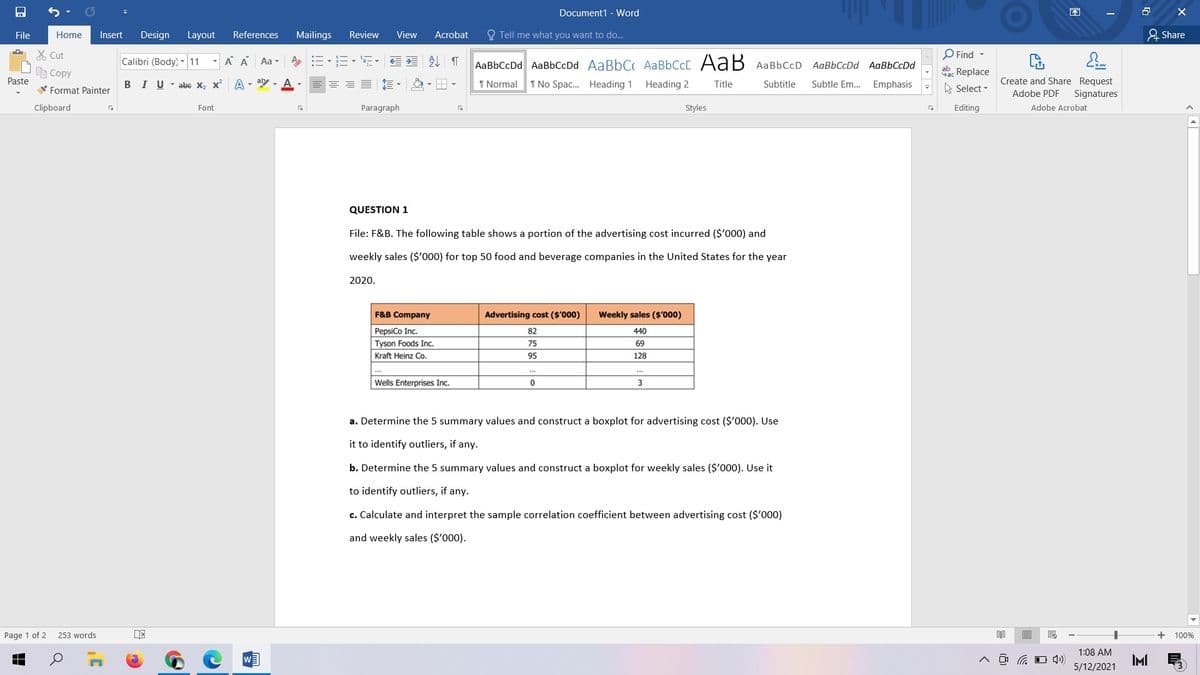
QUESTION 1
File: F&B. The following table shows a portion of the advertising cost incurred ($'000) and
weekly sales ($'000) for top 50 food and beverage companies in the United States for the year
2020.
F&B Company
Advertising cost ($'000)
Weekly sales ($'000)
PepsiCo Inc.
82
440
Tyson Foods Inc.
75
69
Kraft Heinz Co.
95
128
..
Wells Enterprises Inc.
3
a. Determine the 5 summary values and construct a boxplot for advertising cost ($'000). Use
it to identify outliers, if any.
b. Determine the 5 summary values and construct a boxplot for weekly sales ($'000). Use it
to identify outliers, if any.
c. Calculate and interpret the sample correlation coefficient between advertising cost ($'000)
and weekly sales ($'000).
Page 1 of 2
253 words
目
100%
1:08 AM
D ロ)
IMI
5/12/2021
Expert Solution
This question has been solved!
Explore an expertly crafted, step-by-step solution for a thorough understanding of key concepts.

Step by step
Solved in 3 steps

Knowledge Booster


Learn more about
Need a deep-dive on the concept behind this application? Look no further. Learn more about this topic, probability and related others by exploring similar questions and additional content below.Recommended textbooks for you
Algebra & Trigonometry with Analytic Geometry
Algebra
ISBN:
9781133382119
Author:
Swokowski
Publisher:
Cengage
Algebra & Trigonometry with Analytic Geometry
Algebra
ISBN:
9781133382119
Author:
Swokowski
Publisher:
Cengage