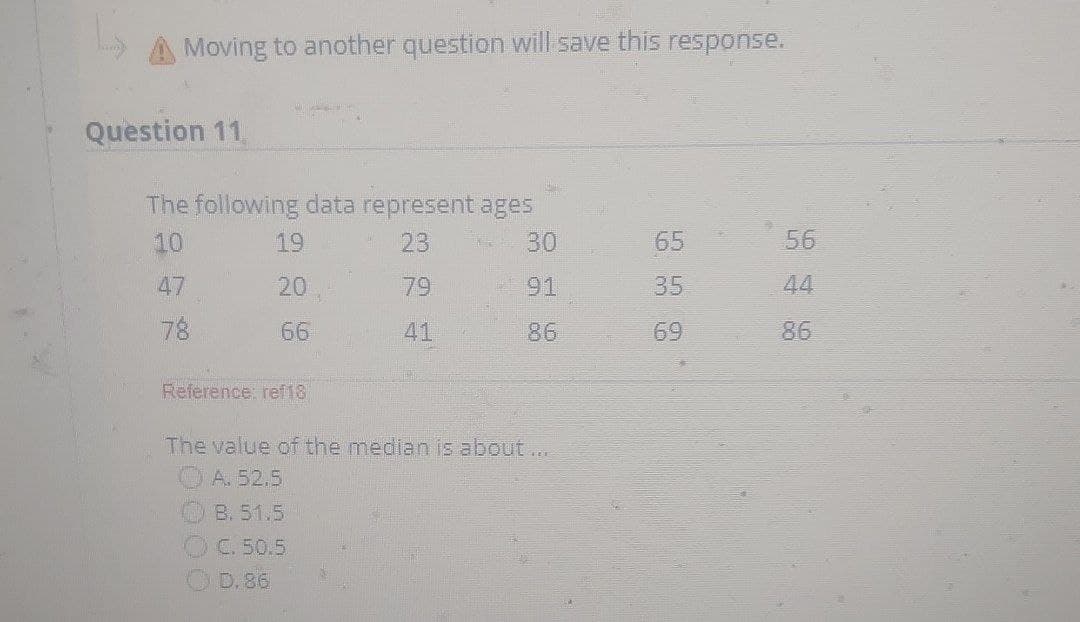
Question 11, The following data represent ages 10 19 23 30 65 56 47 20 79 91 35 44 78 66 41 86 69 86 Reference: ref18 The value of the median is about... O A. 52.5 OB. 51.5 OC. 50.5 D. 86
Q: Score: 3.5/5 4/5 answered Question 4 The following table summarizes the ages of a sample of 56…
A: Explanation:In this given the table and find out the mean In table first finded the class…
Q: QUESTION THREE Table 1 gives the frequency distribution of the daily commuting times (in minutes)…
A: Given table gives the frequency distribution of the daily commuting times (in minutes) from home to…
Q: Based on the data set that has five-number summary: min=13, Q1= 55, Med= 76, Q3=85.5, Max=91 a)…
A: Range = Maximum observation-minimum observation = Max - min Here, max= 91 and Min= 13 Range = 91-13…
Q: Question 18 The dot plots show the ages of students at two different arcades. : 十 + 15 16 17 18 19…
A: A Dot plot also called a dot chart or strip plot , is a type of simple histogram-like chart used in…
Q: QUESTION 20 Find the range for the given data. Fred, a local mechanic, gathered the following data…
A:
Q: Question 11 A survey was conducted in which males and females were surveyed and asked whether they…
A: It was stated that a survey was conducted in which both males and females are asked whether they…
Q: Question 4 Finish times (to frequency histogram. Use five classes. 261 270 236 244 278 296 284 297…
A: Data : 261 270 236 244 278 296 284 297 287 287 250 256 338 360 341 333 261 267 287 296 313 311 309…
Q: Question 5: the following Pie Chart represents the wage of 40 labors in a factory payed in pound.…
A: Given, n= 40 labors
Q: Given the following data set that presents 30 test scores on an exam, find the position of the…
A: Solution: 16. 1. The given data is 49.5, 48, 51, 50, 53.2, 52, 55, 54, 57, 56, 59, 58, 61, 60, 63,…
Q: QUESTION 13 Calculate the relative frequency of X = 110 in the dataset presented in the frequency…
A:
Q: Question 5: the following Pie Chart represents the wage of 40 labors in a factory payed in pound.…
A: 20-29 81 30-39 63 40-49 54 50-59 63 60-69 54 70-79 45 from pie chart 360 degree A= 81…
Q: QUESTION 6 Find the indicated percentile or quartile. The test scores of 32 students are listed…
A: Quartiles: The quartiles divide the distribution into 4 quarters. Data has to be initially arranged…
Q: QUESTION 16 The following data represents ethnicities of the first 25 patients to enter a local…
A: Question 16) Solution: Given information: 3 Asian patients 7 Black patients 7 Hispanic patients 8…
Q: Questions 9 to 10 refer to the following table: f 12 1 11 2 10 1 2 1 7 1 6 2 1 4 3 3 1 2 2 1 2 1…
A: Given Information:
Q: QUESTION 17 Company A, Company B, and Company C sold a number of stocks each month in 2019. Each…
A: The box plots for three companies sold a number of stocks month in 2019 is given.
Q: Question#1 The following data are the measures of the diameters of 36 rivet heads in 1/100 of an…
A: Grouped data,
Q: Question 1 (a) The following information was reported form the survey collected on customers'…
A: Given: Customer satisfaction levels are measured as : A=very satisfied, B=satisfied, C=dissatisfied,…
Q: Question 5 In a box plot, data value x is considered an outlier if O a. x Q3 + 1.0(IQR) O b.x Q2 +…
A: In a boxplot ,data value x is considered an outlier if So in general we have Inter quartile Range…
Q: Question 13 C0/1 pt 55 The following refer to the following data set: 90.6 104.1 74.3 95.8 84.2 86.6…
A: The following is the given data set: 90.6 104.1 74.3 95.8 84.2 86.6 98.8 110.2 110.2 110.2…
Q: Question 12 Data was collected for 40 randomly selected trees growing in the median strip of a busy…
A: Histogram: Histogram is the graphical way of representing the frequency distribution or relative…
Q: Missy Walters owns a mail-order business specializing in baby clothes. She is considering offering…
A: Note: Hey, since there are multiple sub-part questions posted, we will answer first three sub-part…
Q: Question 1 (a) The following information was reported form the survey collected on customers'…
A: Given Data collected from a survey .we need to define the type of data and calculate relative…
Q: Table 13. Question No.2 A seller should know the proper etiquette in selling. Likert Scale Frequency…
A: Dear , student as per guidelines we can solve only 1st question plz upload again remaining parts…
Q: Question#1 The following data are the measures of the diameters of 36 rivet heads in 1/100 of an…
A: The data is presented in a tabular form through a frequency table. The frequency table is obtained…
Q: QUESTION 4 The figure below shows the histogram of the numeric frequency distribution for shoppers'…
A: Given The histogram shows the number of shoppers corresponding to ages which are tabulated as…
Q: QUESTION 22 For the given data in stem-and- leaf display form, find the inter-quartile range 2 | 15…
A: Given data,…
Q: QUESTION 10 GEN 110 section 501 students were asked to state the average time (in minutes) they…
A:
Q: く Question 8 10 8- 6- 4 8. 129 250 371 492 613 Runners [class midpoints shown] Calculate the class…
A: We have to find class width.
Q: Find the 54th percentile, P54, from the following data 6 7 8 10 15 24 30 31 32 33 40 51 54 58 62 64…
A: The number of observations (n) is 28.
Q: Question 4 The table below shows the weekly wages (w), in £ of each of 100 factory workers. Weekly…
A: Since you have posted a question with multiple sub-parts, we will solve first three sub-parts for…
Q: Question 14: The dot plot shows the weight of 10 different babies. 5 6 7 9. 10 What is the median of…
A:
Q: Question 3 a. Twenty Ozone levels around Los Angeles were obtained in a forested area as follows…
A: “Since you have posted a question with multiple sub-parts, we will solve first three subparts for…
Q: Questions #3-#5 are based on the following samp at a day care: 36, 42, 18, 32, 22, 22, 25, 29, 30,…
A: Comment: As per the our company guidelines we are supposed to answer only one question. Kindly…
Q: Question 1 (a) The following information was reported form the survey collected on customers'…
A: Since you have posted questions with multiple sub-parts, we will solve the first three sub-parts for…
Q: QUESTION 3 The following frequency table gives the frequencies for a set of grouped data. class…
A: Given data
Q: Question# 1: These data represent the record high temperatures in degrees Fahrenheit (°F) for each…
A:
Q: Question 1 The table below represents a population of the amount (in RM) spent on food spent through…
A: Frequency Distribution: In Statistical theory, a frequency distribution is a tabular, listed or…
Q: Question 7: The finishing time for the top 100 men in a marathon are displayed in the provided…
A: We want to tell the shape of histogram
Q: Question 1 (a) The following information was reported form the survey collected on customers'…
A: ANSWER (A): This is a non numerical data with categories as A, B, C, D. So, it is a categorical…
Q: Question 1 Use the ungrouped data that you have been supplied with to complete the following: (a)…
A: Given data: 4.4 4.6 4.5 4.4 4.3 4.7 4.7 4.6 4.6 4.8 4.9 4.4 4.5 4.7 4.4 4.5 4.9 4.7 4.5 4.6…
Q: Question 1 (a). The following information was reported form the survey collected on customers'…
A: Since you have posted a question with multiple subparts, we will solve first three subparts for you.…
Q: Questions 12 to 16 refer to the following data. For a sample of 12 offenders convicted of weapons…
A: Given data, 6,6,2,12,17,48,60,24,20,20,18,15 Sample variance=?
Q: QUESTION 12 Find the range for the given data. Rich Borne is currently taking Chemistry 101. On the…
A: Range is the difference between the highest value and the lowest value. Here, the highest value is…
Q: Question 1 For the following frequency distribution table calculate the mean, where the class limit…
A: Concentration of all the values around the central value of the given data is known as measures of…
Q: Question 1 The following data set gives the Life Orientation marks of a sample of Matric students w…
A: Note: Please repost remaining subparts as i can answer only 3 subparts as per my policy. Given…
Q: QUESTION 7 Given the set of data below, find the range. 2, 4, 4, 5, 6, 9 A.2 OB. 7 OC. 9 O D.4
A:
Q: QUESTION 13 Calculate the relative frequency of X = 40 in the dataset presented in the frequency…
A:
Q: Question 2 Find the five-number summary for the following data set. 87 84 89 88 89 81 82 89 88 84…
A: We have given that the data set 87, 84, 89, 88, 89, 81, 82, 89, 88, 84. Median: It is the middle…
Q: Question 1 (a) The following information was reported form the survey collected on customers'…
A: Given Information of a survey,we need to determine the type of data,corresponding histogram and…
Step by step
Solved in 2 steps with 2 images