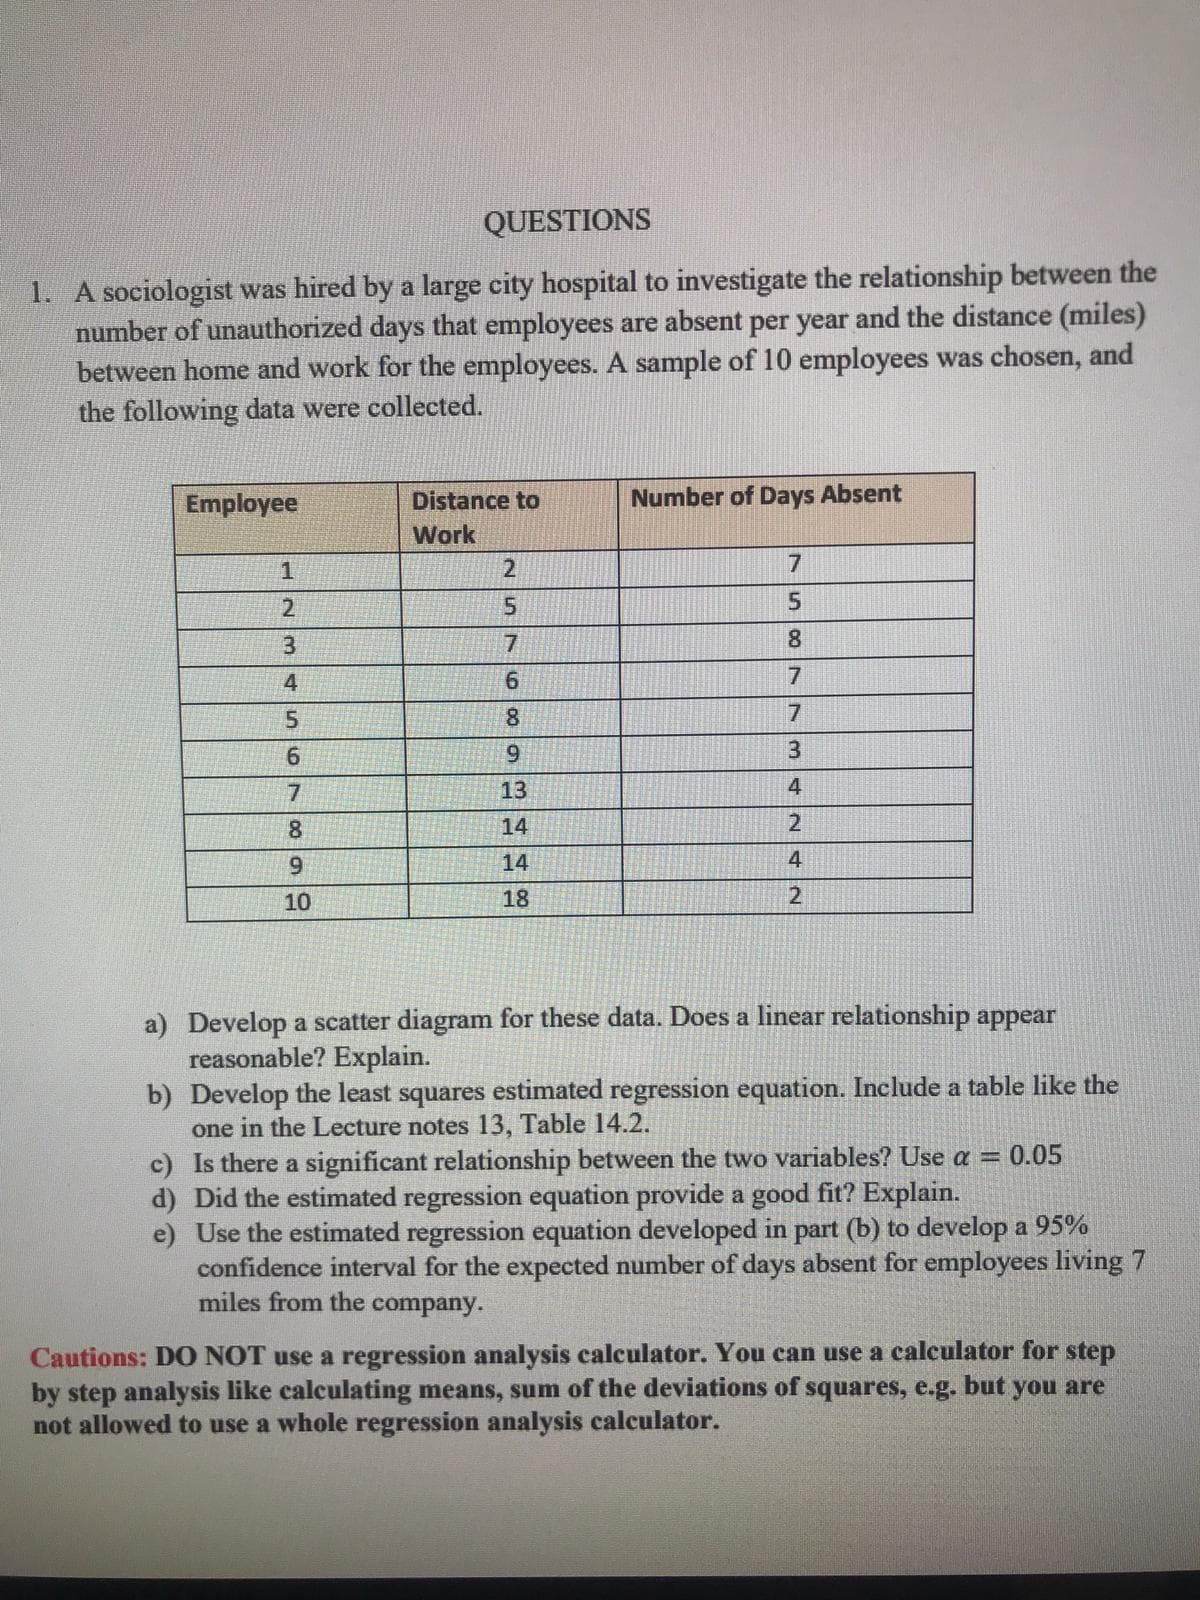
QUESTIONS 1. A sociologist was hired by a large city hospital to investigate the relationship between the number of unauthorized days that employees are absent per year and the distance (miles) between home and work for the employees. A sample of 10 employees was chosen, and the following data were collected. Employee Distance to Number of Days Absent Work 1 7 5. 8. 4 6. 7 5. 8 7 9. 3 13 4 8. 14 21 6. 14 4 10 18 2

Glencoe Algebra 1, Student Edition, 9780079039897, 0079039898, 2018
18th Edition
ISBN:9780079039897
Author:Carter
Publisher:Carter
Chapter4: Equations Of Linear Functions
Section4.5: Correlation And Causation
Problem 24PFA
icon
Related questions
Topic Video
Question
100%

thank you already

QUESTIONS
1. A sociologist was hired by a large city hospital to investigate the relationship between the
number of unauthorized days that employees are absent per year and the distance (miles)
between home and work for the employees. A sample of 10 employees was chosen, and
the following data were collected.
Employee
Distance to
Number of Days Absent
Work
2.
7
8.
4
8.
7.
3
13
8.
14
2
6.
14
4
10
18
2
a) Develop a scatter diagram for these data. Does a linear relationship appear
reasonable? Explain.
b) Develop the least squares estimated regression equation. Include a table like the
one in the Lecture notes 13, Table 14.2.
c) Is there a significant relationship between the two variables? Use a =
d) Did the estimated regression equation provide a good fit? Explain.
e) Use the estimated regression equation developed in part (b) to develop a 95%
confidence interval for the expected number of days absent for employees living 7
miles from the company.
0.05
Cautions: DO NOT use a regression analysis calculator. You can use a calculator for step
by step analysis like calculating means, sum of the deviations of squares, e.g. but you are
not allowed to use a whole regression analysis calculator.
Transcribed Image Text:QUESTIONS 1. A sociologist was hired by a large city hospital to investigate the relationship between the number of unauthorized days that employees are absent per year and the distance (miles) between home and work for the employees. A sample of 10 employees was chosen, and the following data were collected. Employee Distance to Number of Days Absent Work 2. 7 8. 4 8. 7. 3 13 8. 14 2 6. 14 4 10 18 2 a) Develop a scatter diagram for these data. Does a linear relationship appear reasonable? Explain. b) Develop the least squares estimated regression equation. Include a table like the one in the Lecture notes 13, Table 14.2. c) Is there a significant relationship between the two variables? Use a = d) Did the estimated regression equation provide a good fit? Explain. e) Use the estimated regression equation developed in part (b) to develop a 95% confidence interval for the expected number of days absent for employees living 7 miles from the company. 0.05 Cautions: DO NOT use a regression analysis calculator. You can use a calculator for step by step analysis like calculating means, sum of the deviations of squares, e.g. but you are not allowed to use a whole regression analysis calculator.
Expert Solution
trending now

Trending now

This is a popular solution!

steps

Step by step

Solved in 5 steps with 2 images

Blurred answer
Knowledge Booster
Algebraic Operations
Learn more about
Need a deep-dive on the concept behind this application? Look no further. Learn more about this topic, statistics and related others by exploring similar questions and additional content below.
Recommended textbooks for you
Glencoe Algebra 1, Student Edition, 9780079039897…
Algebra
ISBN:
9780079039897
Author:
Carter
Publisher:
McGraw Hill