QUESTION 2: Carib Brewery manufactures Malta Carib. The following data are the number of Malta Caribs sold (in hundreds) to a sample of 60 bars during the last month. 45 33 35 52 42 36 53 31 35 50 34 31 33 49 48 33 35 38 51 32 45 35 52 37 49 34 48 40 50 35 39 36 48 33 50 35 54 39 46 38 41 44 32 55 31 36 54 39 46 46 51 50 42 37 1. Construct a frequency table using 5 classes starting with 31-35, 36-40.... 2. Calculate relative and cumulative frequencies for all classes. 3. Determine the class midpoints and class boundaries. 4. Construct one graph to represent the relative frequency and another to represent the cumulative frequency distribution. 47 40 48 34 37 52
QUESTION 2: Carib Brewery manufactures Malta Carib. The following data are the number of Malta Caribs sold (in hundreds) to a sample of 60 bars during the last month. 45 33 35 52 42 36 53 31 35 50 34 31 33 49 48 33 35 38 51 32 45 35 52 37 49 34 48 40 50 35 39 36 48 33 50 35 54 39 46 38 41 44 32 55 31 36 54 39 46 46 51 50 42 37 1. Construct a frequency table using 5 classes starting with 31-35, 36-40.... 2. Calculate relative and cumulative frequencies for all classes. 3. Determine the class midpoints and class boundaries. 4. Construct one graph to represent the relative frequency and another to represent the cumulative frequency distribution. 47 40 48 34 37 52

Functions and Change: A Modeling Approach to College Algebra (MindTap Course List)
6th Edition
ISBN:9781337111348
Author:Bruce Crauder, Benny Evans, Alan Noell
Publisher:Bruce Crauder, Benny Evans, Alan Noell
Chapter5: A Survey Of Other Common Functions
Section5.3: Modeling Data With Power Functions
Problem 6E: Urban Travel Times Population of cities and driving times are related, as shown in the accompanying...

Related questions
Question
QM - New Question 2
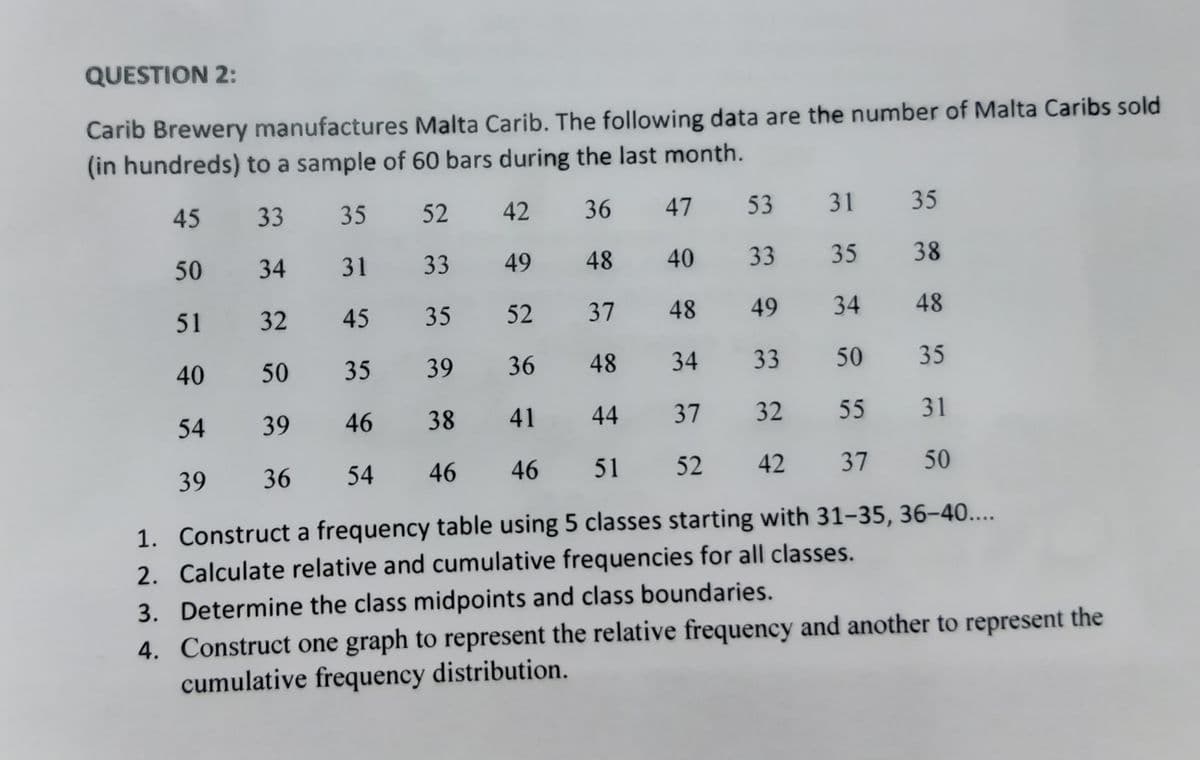
Transcribed Image Text:QUESTION 2:
Carib Brewery manufactures Malta Carib. The following data are the number of Malta Caribs sold
(in hundreds) to a sample of 60 bars during the last month.
45
33
35
52
42
36 47
53
31 35
50
34
31
33
49
48
40 33 35 38
51
32
45
35
52
37
48
49
34
48
40
50
35
39 36
48
34
33 50 35
54
39 46
38 41
44 37
32
55
31
39
36
54
46
46
51
52 42 37 50
1. Construct a frequency table using 5 classes starting with 31-35, 36-40....
2. Calculate relative and cumulative frequencies for all classes.
3. Determine the class midpoints and class boundaries.
4. Construct one graph to represent the relative frequency and another to represent the
cumulative frequency distribution.
Expert Solution
This question has been solved!
Explore an expertly crafted, step-by-step solution for a thorough understanding of key concepts.

Step by step
Solved in 4 steps with 5 images

Recommended textbooks for you
Functions and Change: A Modeling Approach to Coll…
Algebra
ISBN:
9781337111348
Author:
Bruce Crauder, Benny Evans, Alan Noell
Publisher:
Cengage Learning
Functions and Change: A Modeling Approach to Coll…
Algebra
ISBN:
9781337111348
Author:
Bruce Crauder, Benny Evans, Alan Noell
Publisher:
Cengage Learning