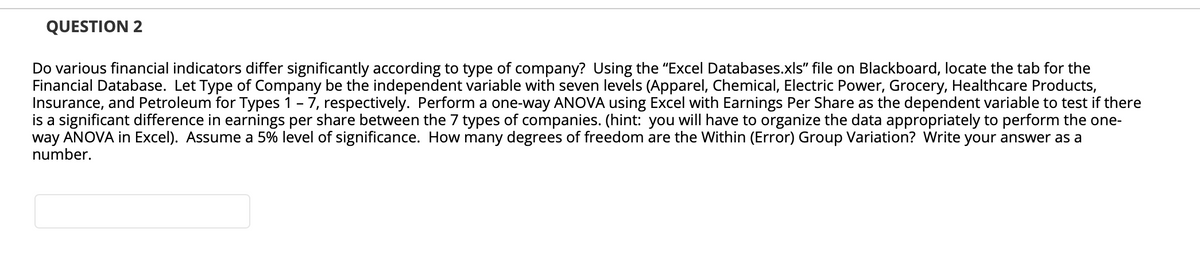
QUESTION 2 Do various financial indicators differ significantly according to type of company? Using the "Excel Databases.xls" file on Blackboard, locate the tab for the Financial Database. Let Type of Company be the independent variable with seven levels (Apparel, Chemical, Electric Power, Grocery, Healthcare Products, Insurance, and Petroleum for Types 1 - 7, respectively. Perform a one-way ANOVA using Excel with Earnings Per Share as the dependent variable to test if there is a significant difference in earnings per share between the 7 types of companies. (hint: you will have to organize the data appropriately to perform the one- way ANOVA in Excel). Assume a 5% level of significance. How many degrees of freedom are the Within (Error) Group Variation? Write your answer as a number.


Addition Rule of Probability
It simply refers to the likelihood of an event taking place whenever the occurrence of an event is uncertain. The probability of a single event can be calculated by dividing the number of successful trials of that event by the total number of trials.
Expected Value
When a large number of trials are performed for any random variable ‘X’, the predicted result is most likely the mean of all the outcomes for the random variable and it is known as expected value also known as expectation. The expected value, also known as the expectation, is denoted by: E(X).
Probability Distributions
Understanding probability is necessary to know the probability distributions. In statistics, probability is how the uncertainty of an event is measured. This event can be anything. The most common examples include tossing a coin, rolling a die, or choosing a card. Each of these events has multiple possibilities. Every such possibility is measured with the help of probability. To be more precise, the probability is used for calculating the occurrence of events that may or may not happen. Probability does not give sure results. Unless the probability of any event is 1, the different outcomes may or may not happen in real life, regardless of how less or how more their probability is.
Basic Probability
The simple definition of probability it is a chance of the occurrence of an event. It is defined in numerical form and the probability value is between 0 to 1. The probability value 0 indicates that there is no chance of that event occurring and the probability value 1 indicates that the event will occur. Sum of the probability value must be 1. The probability value is never a negative number. If it happens, then recheck the calculation.
| Company | Type | Total Revenues | Total Assets | Return on Equity | Earnings per Share | Average Yield | Dividends per Share | Average P/E Ratio |
| AFLAC | 6 | 7251 | 29454 | 17.1 | 2.08 | 0.9 | 0.22 | 11.5 |
| Albertson's | 4 | 14690 | 5219 | 21.4 | 2.08 | 1.6 | 0.63 | 19 |
| Allstate | 6 | 20106 | 80918 | 20.1 | 3.56 | 1 | 0.36 | 10.6 |
| Amerada Hess | 7 | 8340 | 7935 | 0.2 | 0.08 | 1.1 | 0.6 | 698.3 |
| American General | 6 | 3362 | 80620 | 7.1 | 2.19 | 3 | 1.4 | 21.2 |
| American Stores | 4 | 19139 | 8536 | 12.2 | 1.01 | 1.4 | 0.34 | 23.5 |
| Amoco | 7 | 36287 | 32489 | 16.7 | 2.76 | 3.1 | 1.4 | 16.1 |
| Arco Chemical | 2 | 3995 | 4116 | 6.2 | 1.14 | 6.1 | 2.8 | 40.4 |
| Ashland | 7 | 14319 | 7777 | 9.5 | 3.8 | 2.3 | 1.1 | 12.4 |
| Atlantic Richfield | 7 | 19272 | 25322 | 21.8 | 5.41 | 3.8 | 2.83 | 3.8 |
| Bausch & Lomb | 5 | 1916 | 2773 | 6 | 0.89 | 2.6 | 1.04 | 2.6 |
| Baxter International | 5 | 6138 | 8707 | 11.5 | 1.06 | 2.3 | 1.13 | 47.2 |
| Bristol-Myers Squibb | 5 | 16701 | 14977 | 44.4 | 3.14 | 2 | 1.52 | 24.1 |
| Burlington Coat | 1 | 1777 | 775 | 12.3 | 1.18 | 0.1 | 0.02 | 12.9 |
| Central Maine Power | 3 | 954 | 2299 | 2.4 | 0.16 | 7.8 | 0.9 | 79.6 |
| Chevron | 7 | 41950 | 35473 | 18.6 | 4.95 | 3 | 2.28 | 15.2 |
| CIGNA | 6 | 14935 | 108199 | 13.7 | 4.88 | 2 | 1.1 | 11.4 |
| Cinergy | 3 | 4353 | 8858 | 13.3 | 1.59 | 5.1 | 1.8 | 22.4 |
| Dayton Hudson | 1 | 27757 | 14191 | 18 | 1.7 | 1.2 | 0.33 | 16.2 |
| Dillard's | 1 | 6817 | 5592 | 9.2 | 2.31 | 0.4 | 0.16 | 15.7 |
| Dominion Resources | 3 | 7678 | 20193 | 7.9 | 2.15 | 6.8 | 2.58 | 17.7 |
| Dow Chemical | 2 | 20018 | 24040 | 23.6 | 7.7 | 3.6 | 3.24 | 11.6 |
| DPL | 3 | 1356 | 3585 | 13.9 | 1.2 | 5.3 | 0.91 | 14.3 |
| E. I. DuPont DeNemours | 2 | 46653 | 42942 | 21.3 | 2.08 | 2.1 | 1.23 | 27.9 |
| Eastman Chemical | 2 | 4678 | 5778 | 16.3 | 3.63 | 3 | 1.76 | 16 |
| Edison International | 3 | 9235 | 25101 | 12.3 | 1.73 | 4.2 | 1 | 13.6 |
| Engelhard | 2 | 3631 | 2586 | 6.1 | 0.33 | 1.9 | 0.38 | 61.8 |
| Entergy | 3 | 9562 | 27001 | 4.2 | 1.03 | 6.9 | 1.8 | 25.4 |
| Equitable | 6 | 9666 | 151438 | 12.3 | 2.86 | 0.5 | 0.2 | 13.4 |
| Ethyl | 7 | 1064 | 1067 | 53.6 | 0.71 | 5.6 | 0.5 | 12.6 |
| Exxon | 7 | 137242 | 96064 | 19.4 | 3.37 | 2.8 | 1.63 | 17.1 |
| FPL Group | 3 | 6369 | 12449 | 12.2 | 3.57 | 3.7 | 1.92 | 14.4 |
| The GAP | 1 | 6508 | 3338 | 33.7 | 1.3 | 0.7 | 0.2 | 22 |
| Georgia Gulf | 2 | 966 | 613 | 228 | 2.39 | 1.1 | 0.32 | 11.8 |
| GIANT Food | 4 | 4231 | 1522 | 7.9 | 1.18 | 2.4 | 0.78 | 26.9 |
| A & P | 4 | 10262 | 2995 | 6.9 | 1.66 | 1.2 | 0.35 | 17.8 |
| Great Lakes Chemicals | 2 | 1311 | 2270 | 5.5 | 1.19 | 1.3 | 0.62 | 40.5 |
| Green Mountain Power Company | 3 | 179 | 326 | 8.3 | 1.57 | 7.3 | 1.61 | 14 |
| Hannaford Bros. | 4 | 3226 | 1227 | 9.9 | 1.4 | 1.5 | 0.54 | 26.6 |
| Hercules | 2 | 1866 | 2411 | 47 | 3.18 | 2.2 | 1 | 14.5 |
| Houston Industries | 3 | 6873 | 18415 | 8 | 1.66 | 6.6 | 1.5 | 13.7 |
| Jefferson-Pilot | 6 | 2578 | 23131 | 14.5 | 3.47 | 2.3 | 1.04 | 13.3 |
| Johnson & Johnson | 5 | 22629 | 21453 | 26.7 | 2.41 | 1.5 | 0.85 | 24.1 |
| Liberty | 6 | 660 | 3185 | 11.1 | 3.34 | 1.8 | 0.77 | 12.7 |
| The Limited | 1 | 9189 | 4301 | 10.6 | 0.79 | 2.3 | 0.48 | 26.7 |
| Lincoln National | 6 | 4899 | 77175 | 0.4 | 0.21 | 3.1 | 1.96 | 300.2 |
| Lubrizol | 2 | 1674 | 1462 | 19 | 2.66 | 2.6 | 1.01 | 14.5 |
| Lyondell Petrochemical | 7 | 3010 | 1559 | 46.2 | 3.58 | 3.9 | 0.9 | 6.4 |
| Mallinkrodt | 5 | 1868 | 2988 | 14.8 | 2.47 | 1.7 | 0.66 | 16 |
| May Department Stores | 1 | 12685 | 9930 | 20.5 | 3.11 | 2.4 | 1.2 | 16.2 |
| McKesson | 5 | 20857 | 5608 | 11 | 1.59 | 1.2 | 0.5 | 26 |
| Mercantile Stores | 1 | 3144 | 2178 | 7.9 | 3.53 | 2.1 | 1.19 | 16.3 |
| Merck | 5 | 23637 | 25812 | 36.6 | 3.74 | 1.7 | 1.69 | 26.6 |
| Millennium Chemicals | 2 | 3048 | 4326 | 12.6 | 2.47 | 2.9 | 0.6 | 8.3 |
| Mobil | 7 | 65906 | 43559 | 16.8 | 4.01 | 3.1 | 2.12 | 17.2 |
| Monsanto | 2 | 7514 | 10774 | 7.2 | 0.48 | 1.1 | 0.5 | 90.7 |
| Morton | 2 | 2388 | 2805 | 12.3 | 1.48 | 1 | 0.36 | 25.2 |
| Murphy Oil | 7 | 2138 | 2238 | 12.3 | 2.94 | 2.6 | 1.35 | 18 |
| Mylan Laboratories | 5 | 555 | 848 | 13.5 | 0.82 | 0.9 | 0.16 | 22.4 |
| NALCO Chemical | 2 | 1434 | 1441 | 25 | 2.1 | 2.6 | 1 | 18.3 |
| Nevada Power | 3 | 799 | 2339 | 10.1 | 1.65 | 6.8 | 1.6 | 14.2 |
| NIPSCO | 3 | 2587 | 4937 | 14.1 | 1.53 | 4.1 | 0.9 | 14.4 |
| Olin | 2 | 2410 | 1946 | 17.4 | 3 | 2.8 | 1.2 | 14.5 |
| Orion Capital | 6 | 1591 | 3884 | 16 | 4.15 | 1.5 | 0.6 | 9.8 |
| Owens & Minor | 5 | 3117 | 713 | 9.4 | 0.6 | 1.4 | 0.18 | 21.7 |
| Pacific Corporation | 3 | 6278 | 13880 | 5.2 | 0.68 | 4.6 | 1.08 | 34.2 |
| J. C. Penney | 1 | 30546 | 23493 | 7.7 | 2.1 | 3.8 | 2.13 | 26.9 |
| Pennzoil | 7 | 2654 | 4406 | 15.8 | 3.76 | 1.6 | 1 | 17.1 |
| Pfizer | 5 | 12504 | 15336 | 27.9 | 1.7 | 1.1 | 0.68 | 35.4 |
| Pharmacia & Upjohn | 5 | 6710 | 10380 | 5.8 | 0.61 | 3.1 | 1.08 | 56.2 |
| Phillips Petroleum | 7 | 15424 | 13860 | 19.9 | 3.61 | 3 | 1.34 | 12.4 |
| Poe & Brown | 6 | 129 | 194 | 25.1 | 1.48 | 1.5 | 0.35 | 16.3 |
| PPG | 2 | 7379 | 6868 | 28.5 | 3.94 | 2.3 | 1.33 | 14.7 |
| PP&L Resources | 3 | 3049 | 9485 | 11.4 | 1.8 | 7.7 | 1.67 | 12 |
| Progressive | 6 | 4190 | 7560 | 18.7 | 5.31 | 0.3 | 0.24 | 17 |
| Rohm & Haas | 2 | 3999 | 3900 | 19.8 | 2.13 | 2.2 | 0.63 | 13.4 |
| Ruddick | 4 | 2300 | 885 | 12.5 | 1.02 | 1.8 | 0.32 | 17 |
| Schering-Plough | 5 | 6778 | 6507 | 51.2 | 1.95 | 1.5 | 0.74 | 24.6 |
| Sears, Roebuck | 1 | 41296 | 38700 | 20.3 | 2.99 | 1.8 | 0.92 | 17.4 |
| Stryker | 5 | 980 | 985 | 20.5 | 1.28 | 0.3 | 0.11 | 27.2 |
| Sun | 7 | 10531 | 4667 | 18 | 2.7 | 2.8 | 1 | 13 |
| Sunamerica | 6 | 2114 | 35637 | 14.7 | 1.8 | 0.9 | 0.3 | 19.5 |
| Texaco | 7 | 46667 | 29600 | 20.9 | 4.87 | 3.1 | 1.75 | 11.5 |
| The TJX Companies | 1 | 7389 | 2610 | 26.3 | 1.75 | 0.6 | 0.09 | 8.2 |
| Torchmark | 6 | 2283 | 10967 | 17.5 | 2.39 | 1.7 | 0.59 | 14.2 |
| Tosco | 7 | 13282 | 5975 | 10.9 | 1.37 | 0.8 | 0.24 | 23 |
| Travelers | 6 | 37609 | 386555 | 14.9 | 2.54 | 0.9 | 0.4 | 17 |
| Ultramar Diamond Shamrock | 7 | 10882 | 5595 | 9.5 | 1.94 | 3.5 | 1.1 | 16.1 |
| Union Carbide | 2 | 6502 | 6964 | 28.8 | 4.53 | 1.6 | 0.79 | 10.7 |
| United States Surgical Corporation | 5 | 1172 | 1726 | 7.5 | 1.21 | 0.5 | 0.16 | 29 |
| UNOCAL | 7 | 6064 | 7530 | 28.9 | 2.65 | 2 | 0.8 | 15.5 |
| UNUM | 6 | 4077 | 13200 | 15.2 | 2.59 | 1.3 | 0.56 | 17 |
| USX-Marathon | 7 | 15754 | 10565 | 12.6 | 1.58 | 2.4 | 0.76 | 19.8 |
| Valero Energy | 7 | 5756 | 2493 | 9.6 | 2.03 | 1.2 | 0.42 | 17.2 |
| Warner-Lambert | 5 | 8180 | 8031 | 30.7 | 1.04 | 1.4 | 0.51 | 35.7 |
| WEIS Markets | 4 | 1819 | 972 | 9.2 | 1.87 | 3 | 0.94 | 16.9 |
| Wellman | 2 | 1083 | 1319 | 4.8 | 0.97 | 1.8 | 0.35 | 20.5 |
| Winn-Dixie Stores | 4 | 13219 | 2921 | 15.3 | 1.36 | 2.7 | 0.98 | 27.2 |
| WITCO | 2 | 2187 | 2298 | 14 | 1.55 | 2.9 | 1.12 | 24.9 |
| Zenith Nation Insurance | 6 | 601 | 1252 | 7.8 | 1.57 | 3.7 | 1 | 17 |


Trending now
This is a popular solution!

Step by step
Solved in 2 steps


