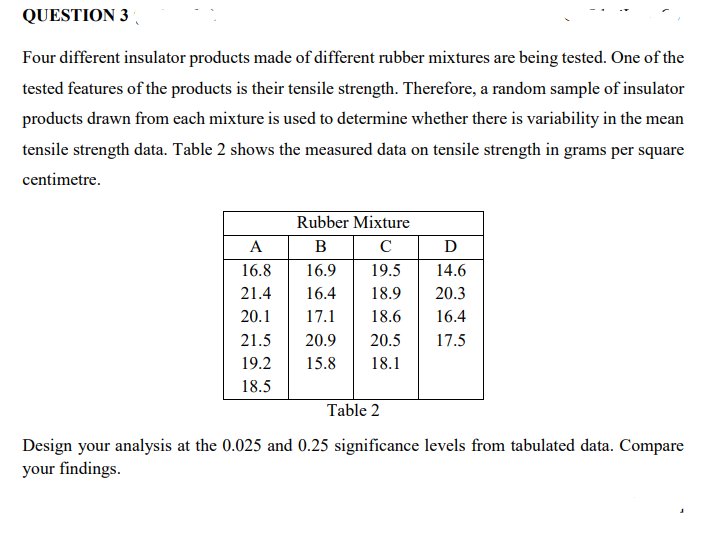
QUESTION 3 Four different insulator products made of different rubber mixtures are being tested. One of the tested features of the products is their tensile strength. Therefore, a random sample of insulator products drawn from each mixture is used to determine whether there is variability in the mean tensile strength data. Table 2 shows the measured data on tensile strength in grams per square centimetre. Rubber Mixture B с 16.9 19.5 16.4 18.9 17.1 18.6 20.5 17.5 18.1 A 16.8 21.4 20.1 21.5 20.9 19.2 15.8 18.5 D 14.6 20.3 16.4 Table 2 Design your analysis at the 0.025 and 0.25 significance levels from tabulated data. Compare your findings.
QUESTION 3 Four different insulator products made of different rubber mixtures are being tested. One of the tested features of the products is their tensile strength. Therefore, a random sample of insulator products drawn from each mixture is used to determine whether there is variability in the mean tensile strength data. Table 2 shows the measured data on tensile strength in grams per square centimetre. Rubber Mixture B с 16.9 19.5 16.4 18.9 17.1 18.6 20.5 17.5 18.1 A 16.8 21.4 20.1 21.5 20.9 19.2 15.8 18.5 D 14.6 20.3 16.4 Table 2 Design your analysis at the 0.025 and 0.25 significance levels from tabulated data. Compare your findings.

Linear Algebra: A Modern Introduction
4th Edition
ISBN:9781285463247
Author:David Poole
Publisher:David Poole
Chapter7: Distance And Approximation
Section7.3: Least Squares Approximation
Problem 31EQ

Related questions
Question
Transcribed Image Text:QUESTION 3
Four different insulator products made of different rubber mixtures are being tested. One of the
tested features of the products is their tensile strength. Therefore, a random sample of insulator
products drawn from each mixture is used to determine whether there is variability in the mean
tensile strength data. Table 2 shows the measured data on tensile strength in grams per square
centimetre.
A
16.8
21.4
20.1
21.5
19.2
18.5
Rubber Mixture
B
с
16.9
19.5
16.4 18.9
17.1
18.6
20.9 20.5
15.8
18.1
D
14.6
20.3
16.4
17.5
Table 2
Design your analysis at the 0.025 and 0.25 significance levels from tabulated data. Compare
your findings.
Expert Solution
This question has been solved!
Explore an expertly crafted, step-by-step solution for a thorough understanding of key concepts.

Step by step
Solved in 2 steps

Recommended textbooks for you
Linear Algebra: A Modern Introduction
Algebra
ISBN:
9781285463247
Author:
David Poole
Publisher:
Cengage Learning

College Algebra
Algebra
ISBN:
9781305115545
Author:
James Stewart, Lothar Redlin, Saleem Watson
Publisher:
Cengage Learning

Glencoe Algebra 1, Student Edition, 9780079039897…
Algebra
ISBN:
9780079039897
Author:
Carter
Publisher:
McGraw Hill
Linear Algebra: A Modern Introduction
Algebra
ISBN:
9781285463247
Author:
David Poole
Publisher:
Cengage Learning
College Algebra
Algebra
ISBN:
9781305115545
Author:
James Stewart, Lothar Redlin, Saleem Watson
Publisher:
Cengage Learning
Glencoe Algebra 1, Student Edition, 9780079039897…
Algebra
ISBN:
9780079039897
Author:
Carter
Publisher:
McGraw Hill