Question 31: Plot the MR and AR from Table 1 and the MC and ATC from Table 2 IN ONE GRAPH. (x-axis = output Q and y-axis = revenues and costs). Label the graph properly. Note: Shade the DWL in the graph and indicate the efficient output level as Q*. Table 1 Table 2 Output Price Total MC ATC Marginal Average Revenue Revenue revenue 4 14 ATR TR = 6 10 AQ 0 0 25 0 8 9 24 24 10 9.5 23 46 12 10 22 66 14 11 21 84 16 11.5 20 100 18 12 19 114 9 20 13 18 126 17 136 What is the price of the 16 144 15 150 monopolist and the profit maximizing output? 14 154 13 156 How much is the profit per unit 12 156 and total profit at this output 11 154 level? 10 150 ه ایران اس اداس اوارامام 1 2 3 4 5 6 7 8 9 10 922 11 12 13 14 15 24 22 20 18 16 14 12 10 8 6 4 2 0 -2 -4 24 23 22 21 20 19 18 17 16 15 14 13 12 11 10 Output 1 2 3 4 567 000 8
Question 31: Plot the MR and AR from Table 1 and the MC and ATC from Table 2 IN ONE GRAPH. (x-axis = output Q and y-axis = revenues and costs). Label the graph properly. Note: Shade the DWL in the graph and indicate the efficient output level as Q*. Table 1 Table 2 Output Price Total MC ATC Marginal Average Revenue Revenue revenue 4 14 ATR TR = 6 10 AQ 0 0 25 0 8 9 24 24 10 9.5 23 46 12 10 22 66 14 11 21 84 16 11.5 20 100 18 12 19 114 9 20 13 18 126 17 136 What is the price of the 16 144 15 150 monopolist and the profit maximizing output? 14 154 13 156 How much is the profit per unit 12 156 and total profit at this output 11 154 level? 10 150 ه ایران اس اداس اوارامام 1 2 3 4 5 6 7 8 9 10 922 11 12 13 14 15 24 22 20 18 16 14 12 10 8 6 4 2 0 -2 -4 24 23 22 21 20 19 18 17 16 15 14 13 12 11 10 Output 1 2 3 4 567 000 8

Managerial Economics: Applications, Strategies and Tactics (MindTap Course List)
14th Edition
ISBN:9781305506381
Author:James R. McGuigan, R. Charles Moyer, Frederick H.deB. Harris
Publisher:James R. McGuigan, R. Charles Moyer, Frederick H.deB. Harris
Chapter17: Long-term Investment Analysis
Section: Chapter Questions
Problem 3.4CE

Related questions
Question
I need answer ASAP. Thank youu!
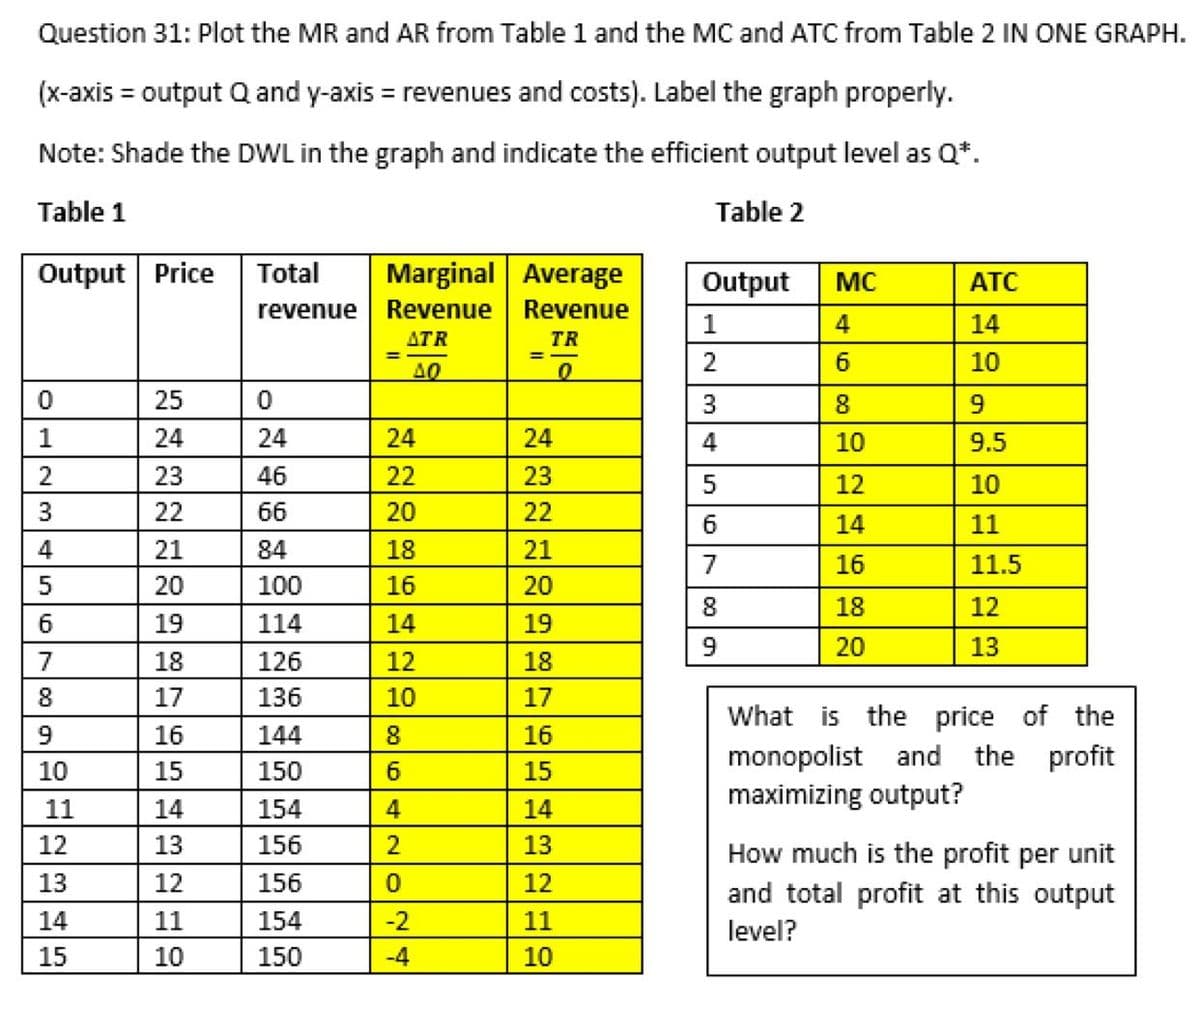
Transcribed Image Text:Question 31: Plot the MR and AR from Table 1 and the MC and ATC from Table 2 IN ONE GRAPH.
(x-axis = output Q and y-axis = revenues and costs). Label the graph properly.
Note: Shade the DWL in the graph and indicate the efficient output level as Q*.
Table 1
Table 2
Output Price
Total
Average
MC
ATC
Marginal
Revenue
revenue
Revenue
4
14
ATR
TR
=
6
10
AQ
0
0
25
0
8
9
24
24
10
9.5
23
46
12
10
22
66
6
14
11
21
84
7
16
11.5
20
100
8
18
12
19
114
9
20
13
18
126
17
136
What is the price of the
16
144
15
150
monopolist and the profit
maximizing output?
14
154
13
15
How much is the profit per unit
12
156
and total profit at this output
11
154
level?
10
150
1
2
3
4
5
6
الامام
7
8
9
922
10
11
13
14
15
45
24
22
20
18
16
14
12
10
8
6
4
0
-2
-4
24
23
22
21
20
19
18
17
16
15
14
13
12
11
10
Output
1
2
3
4
5
Expert Solution
This question has been solved!
Explore an expertly crafted, step-by-step solution for a thorough understanding of key concepts.

Step by step
Solved in 3 steps with 2 images

Knowledge Booster


Learn more about
Need a deep-dive on the concept behind this application? Look no further. Learn more about this topic, economics and related others by exploring similar questions and additional content below.Recommended textbooks for you
Managerial Economics: Applications, Strategies an…
Economics
ISBN:
9781305506381
Author:
James R. McGuigan, R. Charles Moyer, Frederick H.deB. Harris
Publisher:
Cengage Learning


Managerial Economics: Applications, Strategies an…
Economics
ISBN:
9781305506381
Author:
James R. McGuigan, R. Charles Moyer, Frederick H.deB. Harris
Publisher:
Cengage Learning