Question 4 of 7 Big babies: The National Health Statistics Reports described a study in which a sample of 315 one-year-old baby boys were weighed. Their mean weight was 25.6 pounds with standard deviation 5.3 pounds. A pediatrician claims that the mean weight of one-year-old boys is greater than 25 pounds. Do the data provide convincing evidence that the pediatrician's claim is true? Use the o 0.05 level of significance and the critical value method with the @ Critical Values for the Student's t Distribution Table. (a) State the appropriate null and alternate hypotheses. (b) Compute the value of the test statistic. (c) State a conclusion.
Question 4 of 7 Big babies: The National Health Statistics Reports described a study in which a sample of 315 one-year-old baby boys were weighed. Their mean weight was 25.6 pounds with standard deviation 5.3 pounds. A pediatrician claims that the mean weight of one-year-old boys is greater than 25 pounds. Do the data provide convincing evidence that the pediatrician's claim is true? Use the o 0.05 level of significance and the critical value method with the @ Critical Values for the Student's t Distribution Table. (a) State the appropriate null and alternate hypotheses. (b) Compute the value of the test statistic. (c) State a conclusion.

MATLAB: An Introduction with Applications
6th Edition
ISBN:9781119256830
Author:Amos Gilat
Publisher:Amos Gilat
Chapter1: Starting With Matlab
Section: Chapter Questions
Problem 1P

Related questions
Question
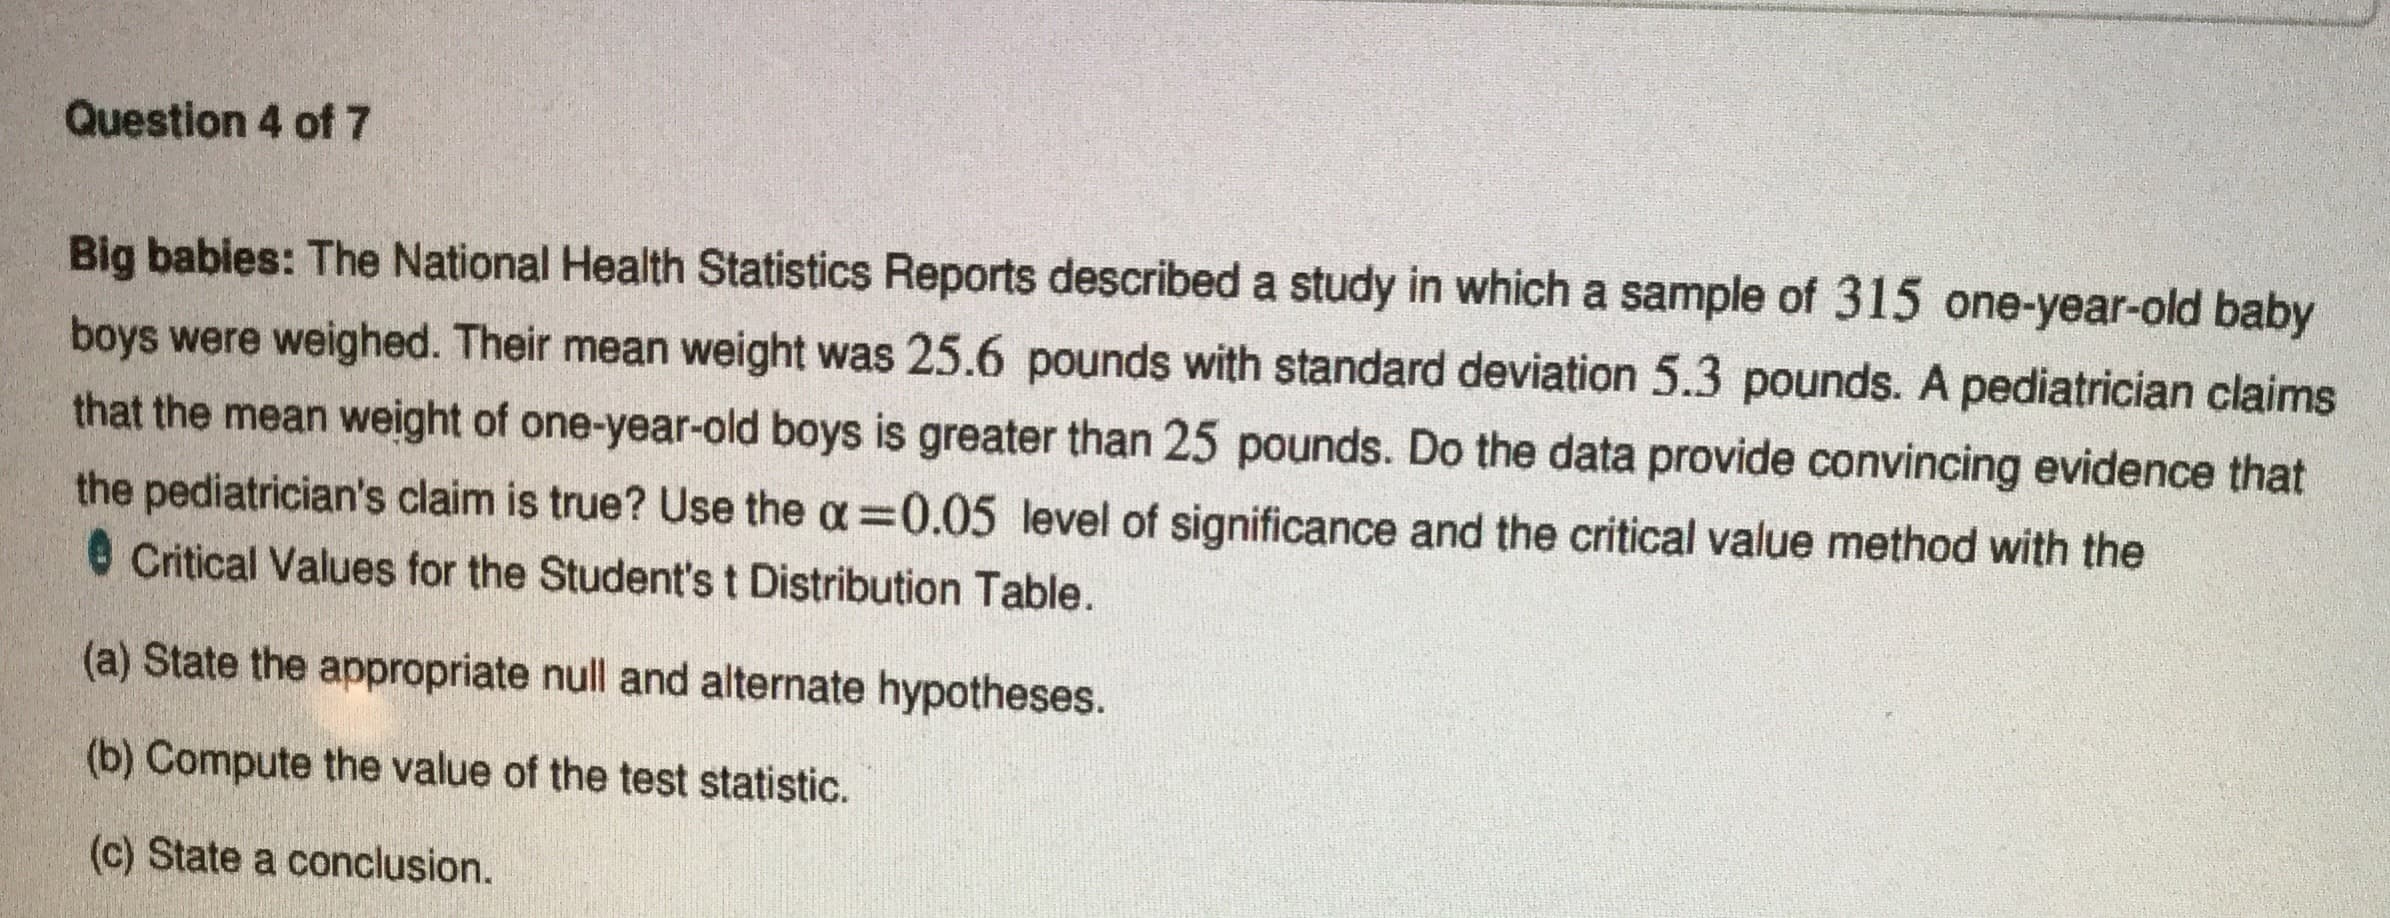
Transcribed Image Text:Question 4 of 7
Big babies: The National Health Statistics Reports described a study in which a sample of 315 one-year-old baby
boys were weighed. Their mean weight was 25.6 pounds with standard deviation 5.3 pounds. A pediatrician claims
that the mean weight of one-year-old boys is greater than 25 pounds. Do the data provide convincing evidence that
the pediatrician's claim is true? Use the o 0.05 level of significance and the critical value method with the
@ Critical Values for the Student's t Distribution Table.
(a) State the appropriate null and alternate hypotheses.
(b) Compute the value of the test statistic.
(c) State a conclusion.
Expert Solution
This question has been solved!
Explore an expertly crafted, step-by-step solution for a thorough understanding of key concepts.

This is a popular solution!

Trending now
This is a popular solution!

Step by step
Solved in 7 steps with 3 images

Recommended textbooks for you
MATLAB: An Introduction with Applications
Statistics
ISBN:
9781119256830
Author:
Amos Gilat
Publisher:
John Wiley & Sons Inc

Probability and Statistics for Engineering and th…
Statistics
ISBN:
9781305251809
Author:
Jay L. Devore
Publisher:
Cengage Learning

Statistics for The Behavioral Sciences (MindTap C…
Statistics
ISBN:
9781305504912
Author:
Frederick J Gravetter, Larry B. Wallnau
Publisher:
Cengage Learning
MATLAB: An Introduction with Applications
Statistics
ISBN:
9781119256830
Author:
Amos Gilat
Publisher:
John Wiley & Sons Inc
Probability and Statistics for Engineering and th…
Statistics
ISBN:
9781305251809
Author:
Jay L. Devore
Publisher:
Cengage Learning
Statistics for The Behavioral Sciences (MindTap C…
Statistics
ISBN:
9781305504912
Author:
Frederick J Gravetter, Larry B. Wallnau
Publisher:
Cengage Learning

Elementary Statistics: Picturing the World (7th E…
Statistics
ISBN:
9780134683416
Author:
Ron Larson, Betsy Farber
Publisher:
PEARSON

The Basic Practice of Statistics
Statistics
ISBN:
9781319042578
Author:
David S. Moore, William I. Notz, Michael A. Fligner
Publisher:
W. H. Freeman

Introduction to the Practice of Statistics
Statistics
ISBN:
9781319013387
Author:
David S. Moore, George P. McCabe, Bruce A. Craig
Publisher:
W. H. Freeman