QUESTION 40 The results from a statistics class' first exam are as follows: The average grade obtained on the exam by its 45 students is an 85, with a standa deviation of 15 points. Answer the following based on this information: What grade is required in order to be in the top 20 percent? QUESTION 41 The results from a statistics class' first exam are as follows: The average grade obtained on the exam by its 45 students is an 85, with a standa deviation of 15 points. Answer the following based on this information: What percentage of people received a grade between 89 and 95? QUESTION 42 The results from a statistics class' first exam are as follows: The average grade obtained on the exam by its 45 students is an 85, with a standar deviation of 15 points. Answer the following based on this information: What percentage of people received a grade of 94 or less? OUESTI ON A2 Click Save and Submit to save and submit. Click Save All Answers to save all answers.
QUESTION 40 The results from a statistics class' first exam are as follows: The average grade obtained on the exam by its 45 students is an 85, with a standa deviation of 15 points. Answer the following based on this information: What grade is required in order to be in the top 20 percent? QUESTION 41 The results from a statistics class' first exam are as follows: The average grade obtained on the exam by its 45 students is an 85, with a standa deviation of 15 points. Answer the following based on this information: What percentage of people received a grade between 89 and 95? QUESTION 42 The results from a statistics class' first exam are as follows: The average grade obtained on the exam by its 45 students is an 85, with a standar deviation of 15 points. Answer the following based on this information: What percentage of people received a grade of 94 or less? OUESTI ON A2 Click Save and Submit to save and submit. Click Save All Answers to save all answers.

Functions and Change: A Modeling Approach to College Algebra (MindTap Course List)
6th Edition
ISBN:9781337111348
Author:Bruce Crauder, Benny Evans, Alan Noell
Publisher:Bruce Crauder, Benny Evans, Alan Noell
Chapter5: A Survey Of Other Common Functions
Section5.3: Modeling Data With Power Functions
Problem 6E: Urban Travel Times Population of cities and driving times are related, as shown in the accompanying...

Related questions

Question
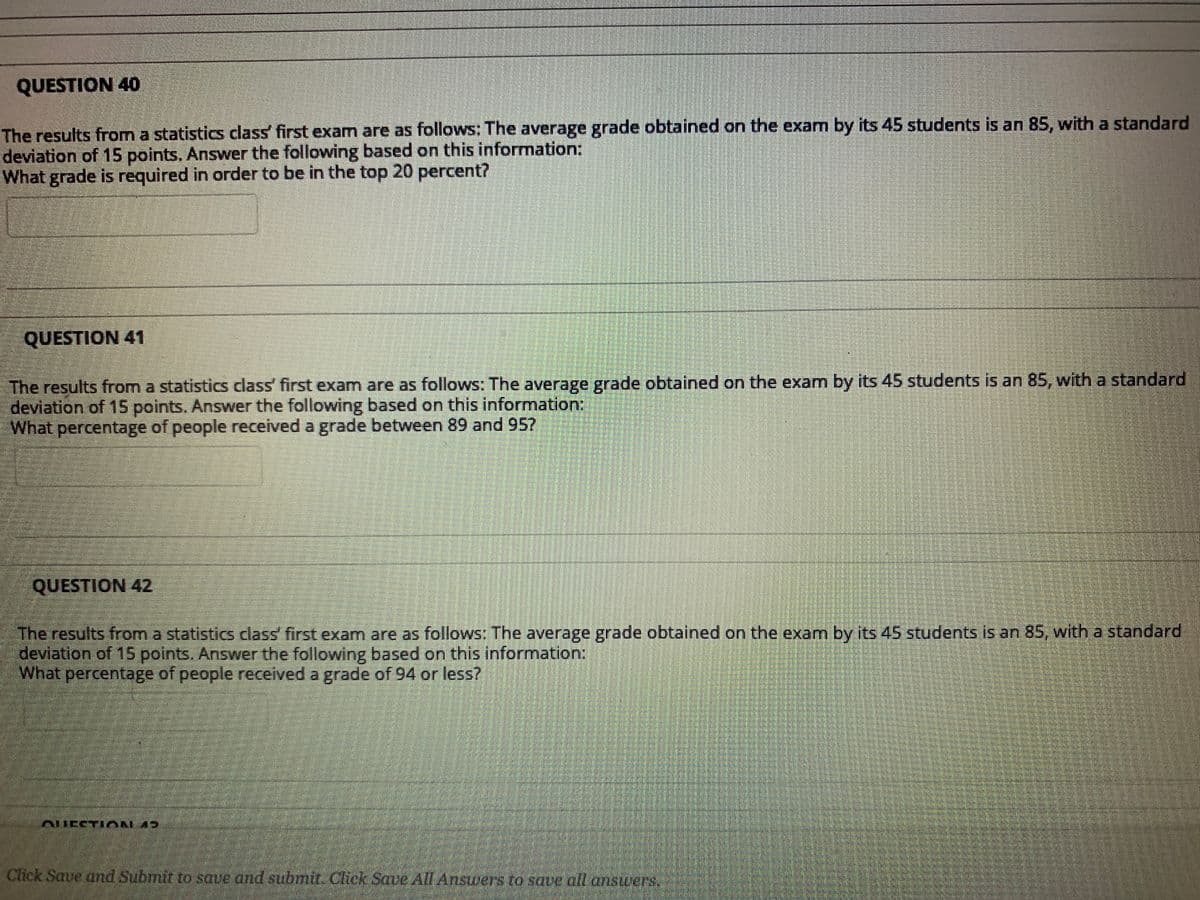
Transcribed Image Text:QUESTION 40
The results from a statisticS class' first exam are as follows: The average grade obtained on the exam by its 45 students is an 85, with a standard
deviation of 15 points. Answer the following based on this information:
What grade is required in order to be in the top 20 percent?
QUESTION 41
The results from a statistics class' first exam are as follows: The average grade obtained on the exam by its 45 students is an 85, with a standard
deviation of 15 points. Answer the following based on this information:
What percentage of people received a grade between 89 and 957
QUESTION 42
The results from a statistics class' first exam are as follows: The average grade obtained on the exam by its 45 students is an 85, with a standard
deviation of 15 points. Answer the following based on this information
What
percentage of people received a grade of 94 or less?
OUECTI
Click Save and Submit to save and submit. Click Save All Answers to save alanswers.
Expert Solution
This question has been solved!
Explore an expertly crafted, step-by-step solution for a thorough understanding of key concepts.

This is a popular solution!

Trending now
This is a popular solution!

Step by step
Solved in 2 steps with 1 images

Knowledge Booster


Learn more about
Need a deep-dive on the concept behind this application? Look no further. Learn more about this topic, statistics and related others by exploring similar questions and additional content below.Recommended textbooks for you
Functions and Change: A Modeling Approach to Coll…
Algebra
ISBN:
9781337111348
Author:
Bruce Crauder, Benny Evans, Alan Noell
Publisher:
Cengage Learning

Glencoe Algebra 1, Student Edition, 9780079039897…
Algebra
ISBN:
9780079039897
Author:
Carter
Publisher:
McGraw Hill
Functions and Change: A Modeling Approach to Coll…
Algebra
ISBN:
9781337111348
Author:
Bruce Crauder, Benny Evans, Alan Noell
Publisher:
Cengage Learning
Glencoe Algebra 1, Student Edition, 9780079039897…
Algebra
ISBN:
9780079039897
Author:
Carter
Publisher:
McGraw Hill