Question 5 く > You want to obtain a sample to estimate a population mean. Based on previous evidence, you believe the population standard deviation is approximately o = 70.6. You would like to be 98% confident that your estimate is within 1 of the true population mean. How large of a sample size is required? n = Do not round mid-calculation. However, you are encouraged to use a critical value accurate to three decimal places – this is important for the system to be able to give hints for incorrect answers.
Question 5 く > You want to obtain a sample to estimate a population mean. Based on previous evidence, you believe the population standard deviation is approximately o = 70.6. You would like to be 98% confident that your estimate is within 1 of the true population mean. How large of a sample size is required? n = Do not round mid-calculation. However, you are encouraged to use a critical value accurate to three decimal places – this is important for the system to be able to give hints for incorrect answers.

Linear Algebra: A Modern Introduction
4th Edition
ISBN:9781285463247
Author:David Poole
Publisher:David Poole
Chapter4: Eigenvalues And Eigenvectors
Section4.6: Applications And The Perron-frobenius Theorem
Problem 25EQ

Related questions
Question
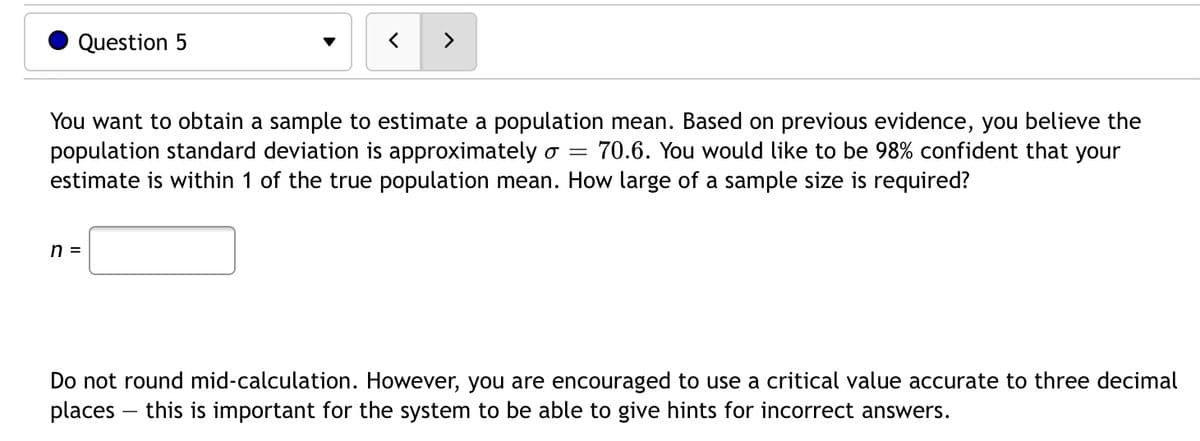
Transcribed Image Text:Question 5
You want to obtain a sample to estimate a population mean. Based on previous evidence, you believe the
population standard deviation is approximately o =
estimate is within 1 of the true population mean. How large of a sample size is required?
70.6. You would like to be 98% confident that your
n =
Do not round mid-calculation. However, you are encouraged to use a critical value accurate to three decimal
places – this is important for the system to be able to give hints for incorrect answers.
Expert Solution
This question has been solved!
Explore an expertly crafted, step-by-step solution for a thorough understanding of key concepts.

Step by step
Solved in 2 steps with 2 images

Recommended textbooks for you
Linear Algebra: A Modern Introduction
Algebra
ISBN:
9781285463247
Author:
David Poole
Publisher:
Cengage Learning


College Algebra
Algebra
ISBN:
9781305115545
Author:
James Stewart, Lothar Redlin, Saleem Watson
Publisher:
Cengage Learning
Linear Algebra: A Modern Introduction
Algebra
ISBN:
9781285463247
Author:
David Poole
Publisher:
Cengage Learning
College Algebra
Algebra
ISBN:
9781305115545
Author:
James Stewart, Lothar Redlin, Saleem Watson
Publisher:
Cengage Learning