Question 5 The solar energy consumed (in trillion BTU) in the United States by year from 2000 to 2015 is shown in the following table. Read down then across for year. Check the assumption of normality in the population. Construct a 90% confidence interval for the mean solar energy consumed. Include your solutions. 55.291 59.718 62.688 63.886 66.458 68.548 69.857 70.833 70.237 69.787 68.793 66.388 65.454 64.391 63.62 63.287
Question 5 The solar energy consumed (in trillion BTU) in the United States by year from 2000 to 2015 is shown in the following table. Read down then across for year. Check the assumption of normality in the population. Construct a 90% confidence interval for the mean solar energy consumed. Include your solutions. 55.291 59.718 62.688 63.886 66.458 68.548 69.857 70.833 70.237 69.787 68.793 66.388 65.454 64.391 63.62 63.287

MATLAB: An Introduction with Applications
6th Edition
ISBN:9781119256830
Author:Amos Gilat
Publisher:Amos Gilat
Chapter1: Starting With Matlab
Section: Chapter Questions
Problem 1P

Related questions
Question
answer it within 30 mins with complete solution
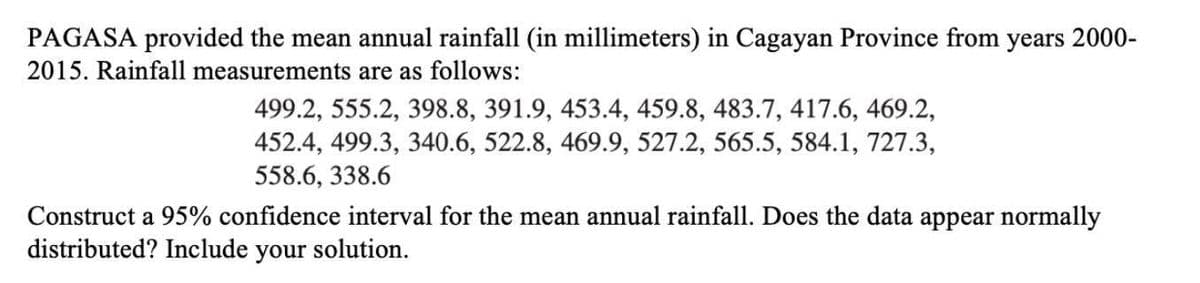
Transcribed Image Text:PAGASA provided the mean annual rainfall (in millimeters) in Cagayan Province from years 2000-
2015. Rainfall measurements are as follows:
499.2, 555.2, 398.8, 391.9, 453.4, 459.8, 483.7, 417.6, 469.2,
452.4, 499.3, 340.6, 522.8, 469.9, 527.2, 565.5, 584.1, 727.3,
558.6, 338.6
Construct a 95% confidence interval for the mean annual rainfall. Does the data appear normally
distributed? Include your solution.
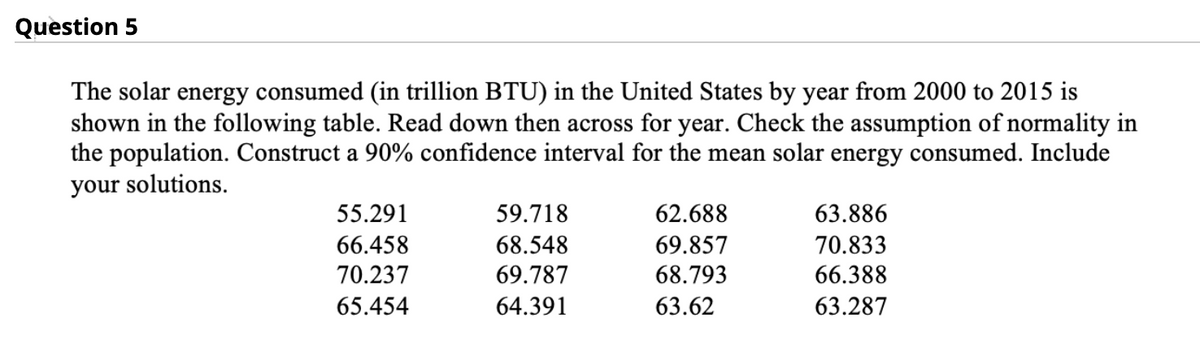
Transcribed Image Text:Question 5
The solar energy consumed (in trillion BTU) in the United States by year from 2000 to 2015 is
shown in the following table. Read down then across for year. Check the assumption of normality in
the population. Construct a 90% confidence interval for the mean solar energy consumed. Include
your solutions.
55.291
59.718
62.688
63.886
66.458
68.548
69.857
70.833
70.237
69.787
68.793
66.388
65.454
64.391
63.62
63.287
Expert Solution
This question has been solved!
Explore an expertly crafted, step-by-step solution for a thorough understanding of key concepts.

Step by step
Solved in 3 steps with 4 images

Recommended textbooks for you
MATLAB: An Introduction with Applications
Statistics
ISBN:
9781119256830
Author:
Amos Gilat
Publisher:
John Wiley & Sons Inc

Probability and Statistics for Engineering and th…
Statistics
ISBN:
9781305251809
Author:
Jay L. Devore
Publisher:
Cengage Learning

Statistics for The Behavioral Sciences (MindTap C…
Statistics
ISBN:
9781305504912
Author:
Frederick J Gravetter, Larry B. Wallnau
Publisher:
Cengage Learning
MATLAB: An Introduction with Applications
Statistics
ISBN:
9781119256830
Author:
Amos Gilat
Publisher:
John Wiley & Sons Inc
Probability and Statistics for Engineering and th…
Statistics
ISBN:
9781305251809
Author:
Jay L. Devore
Publisher:
Cengage Learning
Statistics for The Behavioral Sciences (MindTap C…
Statistics
ISBN:
9781305504912
Author:
Frederick J Gravetter, Larry B. Wallnau
Publisher:
Cengage Learning

Elementary Statistics: Picturing the World (7th E…
Statistics
ISBN:
9780134683416
Author:
Ron Larson, Betsy Farber
Publisher:
PEARSON

The Basic Practice of Statistics
Statistics
ISBN:
9781319042578
Author:
David S. Moore, William I. Notz, Michael A. Fligner
Publisher:
W. H. Freeman

Introduction to the Practice of Statistics
Statistics
ISBN:
9781319013387
Author:
David S. Moore, George P. McCabe, Bruce A. Craig
Publisher:
W. H. Freeman