QUESTION 7 A dairy products factory wants to know the milk flavour preferred by the buyers. The researchers randomly selected several supermarket visitors and conducted an experiment. Buyers were given three cups of milk with different flavours to drink. After that, they were asked to choose one flavor that they preferred the most. The data collected are shown in the following table.
QUESTION 7 A dairy products factory wants to know the milk flavour preferred by the buyers. The researchers randomly selected several supermarket visitors and conducted an experiment. Buyers were given three cups of milk with different flavours to drink. After that, they were asked to choose one flavor that they preferred the most. The data collected are shown in the following table.

Glencoe Algebra 1, Student Edition, 9780079039897, 0079039898, 2018
18th Edition
ISBN:9780079039897
Author:Carter
Publisher:Carter
Chapter10: Statistics
Section10.6: Summarizing Categorical Data
Problem 10CYU

Related questions
Question
100%
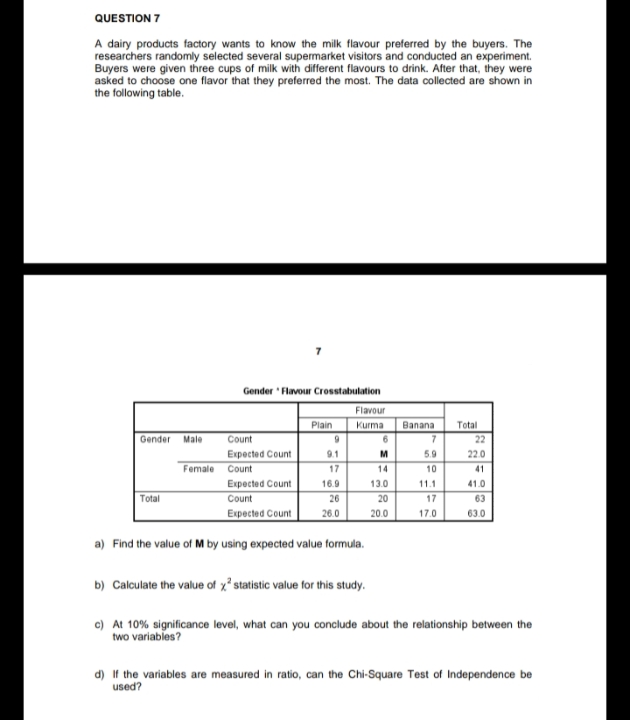
Transcribed Image Text:QUESTION 7
A dairy products factory wants to know the milk flavour preferred by the buyers. The
researchers randomly selected several supermarket visitors and conducted an experiment.
Buyers were given three cups of milk with different flavours to drink. After that, they were
asked to choose one flavor that they preferred the most. The data collected are shown in
the following table.
Gender Flavour Crosstabulation
Flavour
Plain
Kurma
Banana
Total
Gender Male
Count
22
Expected Count
Count
9.1
5.9
22.0
Female
17
14
10
41
Expected Count
16.9
13.0
11.1
41.0
Total
Count
26
20
17
63
Expected Count
26.0
20.0
17.0
63.0
a) Find the value of M by using expected value formula.
b) Calculate the value of x² statistic value for this study.
c) At 10% significance level, what can you conclude about the relationship between the
two variables?
d) If the variables are measured in ratio, can the Chi-Square Test of Independence be
used?
Expert Solution
This question has been solved!
Explore an expertly crafted, step-by-step solution for a thorough understanding of key concepts.

Step by step
Solved in 4 steps with 2 images

Recommended textbooks for you
Glencoe Algebra 1, Student Edition, 9780079039897…
Algebra
ISBN:
9780079039897
Author:
Carter
Publisher:
McGraw Hill

Functions and Change: A Modeling Approach to Coll…
Algebra
ISBN:
9781337111348
Author:
Bruce Crauder, Benny Evans, Alan Noell
Publisher:
Cengage Learning
Glencoe Algebra 1, Student Edition, 9780079039897…
Algebra
ISBN:
9780079039897
Author:
Carter
Publisher:
McGraw Hill
Functions and Change: A Modeling Approach to Coll…
Algebra
ISBN:
9781337111348
Author:
Bruce Crauder, Benny Evans, Alan Noell
Publisher:
Cengage Learning