QUESTION 7 Select the CORRECT statements. It is usually a good idea to have less than 4 classes in a frequency table (or a histogram). Given a normal (bell-shaped) distribution with the mean of 12 and the standard deviation of 4, five percent of observations will be above 20. The coefficient of variation is equal to 66.67% when the mean is 8 and the standard deviation is 12. Given the variance of 5.78, the standard deviation is 2.4. Car speed is an example of a quantitative variable. QUESTION 8 John began analysing the data he has just obtained. His first step was to find the mean and the variance. The mean was 4164 and the variance was 5262. Then he also found the minimum value in the dataset, which appeared to be 343. The maximum value appeared to be 9189. What was the coefficient of variation (coefficient of variability)? Give your answer as % with two decimal places. For example for 0.4521 type 45.21. Do not type the symbol % with your answer. QUESTION 9 A dataset has mean 558.22, standard deviation 185.33, and the following quartiles: 1st quartile 129.22, 2nd quartile 534.33 and 3rd quartile 703.19. Jaspreet decided to divide Interquartile Range by the median. What will be her result? Round your answer to 4 dec laces.
QUESTION 7 Select the CORRECT statements. It is usually a good idea to have less than 4 classes in a frequency table (or a histogram). Given a normal (bell-shaped) distribution with the mean of 12 and the standard deviation of 4, five percent of observations will be above 20. The coefficient of variation is equal to 66.67% when the mean is 8 and the standard deviation is 12. Given the variance of 5.78, the standard deviation is 2.4. Car speed is an example of a quantitative variable. QUESTION 8 John began analysing the data he has just obtained. His first step was to find the mean and the variance. The mean was 4164 and the variance was 5262. Then he also found the minimum value in the dataset, which appeared to be 343. The maximum value appeared to be 9189. What was the coefficient of variation (coefficient of variability)? Give your answer as % with two decimal places. For example for 0.4521 type 45.21. Do not type the symbol % with your answer. QUESTION 9 A dataset has mean 558.22, standard deviation 185.33, and the following quartiles: 1st quartile 129.22, 2nd quartile 534.33 and 3rd quartile 703.19. Jaspreet decided to divide Interquartile Range by the median. What will be her result? Round your answer to 4 dec laces.

MATLAB: An Introduction with Applications
6th Edition
ISBN:9781119256830
Author:Amos Gilat
Publisher:Amos Gilat
Chapter1: Starting With Matlab
Section: Chapter Questions
Problem 1P

Related questions
Question
Transcribed Image Text:QUESTION 7
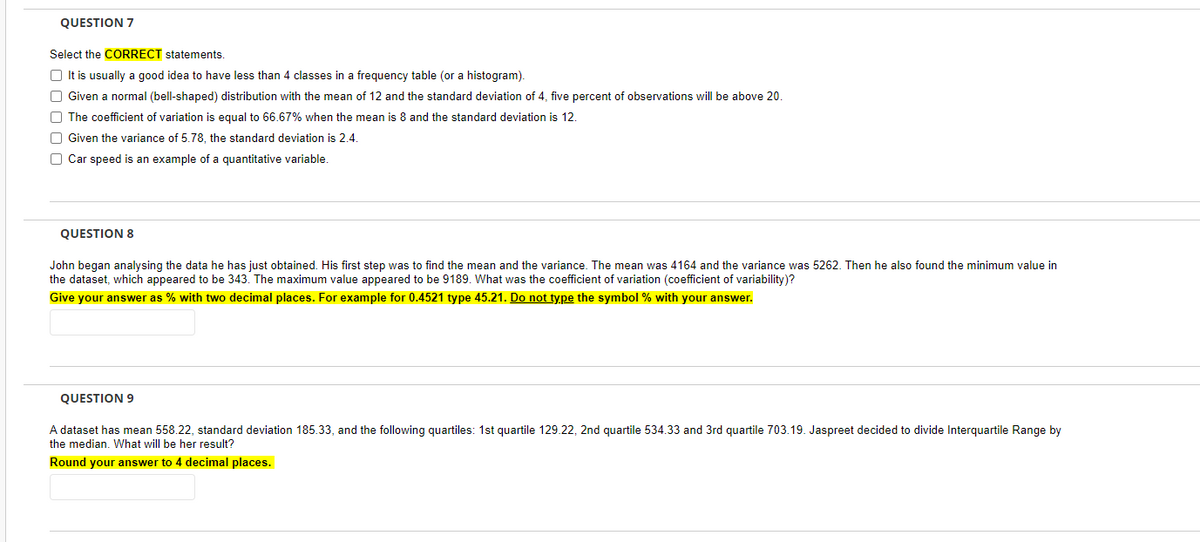
Select the CORRECT statements.
It is usually a good idea to have less than 4 classes in a frequency table (or a histogram).
Given a normal (bell-shaped) distribution with the mean of 12 and the standard deviation of 4, five percent of observations will be above 20.
The coefficient of variation is equal to 66.67% when the mean is 8 and the standard deviation is 12.
Given the variance of 5.78, the standard deviation is 2.4.
Car speed is an example of a quantitative variable.
QUESTION 8
John began analysing the data he has just obtained. His first step was to find the mean and the variance. The mean was 4164 and the variance was 5262. Then he also found the minimum value in
the dataset, which appeared to be 343. The maximum value appeared to be 9189. What was the coefficient of variation (coefficient of variability)?
Give your answer as % with two decimal places. For example for 0.4521 type 45.21. Do not type the symbol % with your answer.
QUESTION 9
A dataset has mean 558.22, standard deviation 185.33, and the following quartiles: 1st quartile 129.22, 2nd quartile 534.33 and 3rd quartile 703.19. Jaspreet decided to divide Interquartile Range by
the median. What will be her result?
Round your answer to 4 decimal places.
Expert Solution
This question has been solved!
Explore an expertly crafted, step-by-step solution for a thorough understanding of key concepts.

This is a popular solution!

Trending now
This is a popular solution!

Step by step
Solved in 2 steps with 2 images

Recommended textbooks for you
MATLAB: An Introduction with Applications
Statistics
ISBN:
9781119256830
Author:
Amos Gilat
Publisher:
John Wiley & Sons Inc

Probability and Statistics for Engineering and th…
Statistics
ISBN:
9781305251809
Author:
Jay L. Devore
Publisher:
Cengage Learning

Statistics for The Behavioral Sciences (MindTap C…
Statistics
ISBN:
9781305504912
Author:
Frederick J Gravetter, Larry B. Wallnau
Publisher:
Cengage Learning
MATLAB: An Introduction with Applications
Statistics
ISBN:
9781119256830
Author:
Amos Gilat
Publisher:
John Wiley & Sons Inc
Probability and Statistics for Engineering and th…
Statistics
ISBN:
9781305251809
Author:
Jay L. Devore
Publisher:
Cengage Learning
Statistics for The Behavioral Sciences (MindTap C…
Statistics
ISBN:
9781305504912
Author:
Frederick J Gravetter, Larry B. Wallnau
Publisher:
Cengage Learning

Elementary Statistics: Picturing the World (7th E…
Statistics
ISBN:
9780134683416
Author:
Ron Larson, Betsy Farber
Publisher:
PEARSON

The Basic Practice of Statistics
Statistics
ISBN:
9781319042578
Author:
David S. Moore, William I. Notz, Michael A. Fligner
Publisher:
W. H. Freeman

Introduction to the Practice of Statistics
Statistics
ISBN:
9781319013387
Author:
David S. Moore, George P. McCabe, Bruce A. Craig
Publisher:
W. H. Freeman