QUESTION 8 An extensive survey in 1970 revealed preschool children spend an average of 6.3 hours per day watching television. The distribution of TV times in normal with a population standard deviation of 2 hours. Last year a sample of 100 preschool children had a mean of 5.8 hours of TV watching per day. Test to determine if the average time preschool children spend watching TV per day has decreased at the 0.01 significance level. Part A- Ho: H = Part B- Ha: H Part C-State alpha Part D-Reject null if (Answer f should be the inequality
QUESTION 8 An extensive survey in 1970 revealed preschool children spend an average of 6.3 hours per day watching television. The distribution of TV times in normal with a population standard deviation of 2 hours. Last year a sample of 100 preschool children had a mean of 5.8 hours of TV watching per day. Test to determine if the average time preschool children spend watching TV per day has decreased at the 0.01 significance level. Part A- Ho: H = Part B- Ha: H Part C-State alpha Part D-Reject null if (Answer f should be the inequality

Glencoe Algebra 1, Student Edition, 9780079039897, 0079039898, 2018
18th Edition
ISBN:9780079039897
Author:Carter
Publisher:Carter
Chapter10: Statistics
Section10.5: Comparing Sets Of Data
Problem 14PPS

Related questions

Question
Transcribed Image Text:QUESTION 8
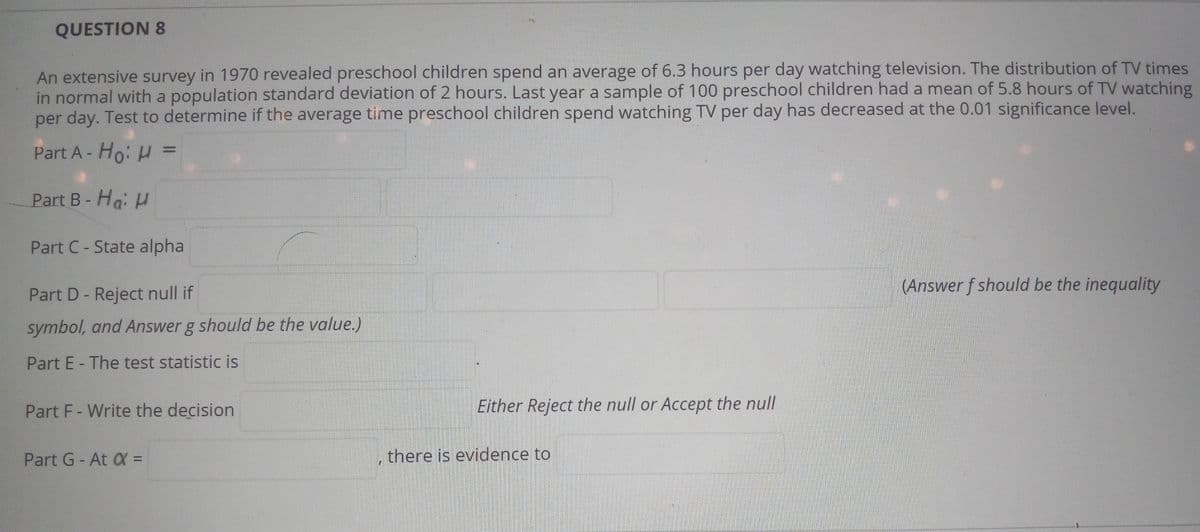
An extensive survey in 1970 revealed preschool children spend an average of 6.3 hours per day watching television. The distribution of TV times
in normal with a population standard deviation of 2 hours. Last year a sample of 100 preschool children had a mean of 5.8 hours of TV watching
per day. Test to determine if the average time preschool children spend watching TV per day has decreased at the 0.01 significance level.
Part A- Ho: H =
%3D
Part B- Ha: H
Part C- State alpha
(Answer f should be the inequality
Part D- Reject null if
symbol, and Answer g should be the value.)
Part E - The test statistic is
Part F- Write the decision
Either Reject the null or Accept the null
Part G-At X =
there is evidence to
Expert Solution
This question has been solved!
Explore an expertly crafted, step-by-step solution for a thorough understanding of key concepts.

This is a popular solution!

Trending now
This is a popular solution!

Step by step
Solved in 2 steps

Knowledge Booster


Learn more about
Need a deep-dive on the concept behind this application? Look no further. Learn more about this topic, statistics and related others by exploring similar questions and additional content below.Recommended textbooks for you
Glencoe Algebra 1, Student Edition, 9780079039897…
Algebra
ISBN:
9780079039897
Author:
Carter
Publisher:
McGraw Hill
Glencoe Algebra 1, Student Edition, 9780079039897…
Algebra
ISBN:
9780079039897
Author:
Carter
Publisher:
McGraw Hill