QUESTION 8 Sample Size Sample Mean Sample Standard Deviation df Confidence Interval (in terms of New - Last Year) Confidence Coefficient Lower Limit Upper Limit Hypothesis Test (in terms of New - Last Year) Hypothesized Value Test Statistic p-value (Lower Tail) p-value (Upper Tail) p-value (Two Tail) Sample Size Sample Mean Sample Standard Deviation New 36 75.1667 17.2105 56 0.80 1.6025 10.2308 0 1.7786 Last Year 36 69.2500 10.1090 New-Last Year 36 5.9167 23.3243
QUESTION 8 Sample Size Sample Mean Sample Standard Deviation df Confidence Interval (in terms of New - Last Year) Confidence Coefficient Lower Limit Upper Limit Hypothesis Test (in terms of New - Last Year) Hypothesized Value Test Statistic p-value (Lower Tail) p-value (Upper Tail) p-value (Two Tail) Sample Size Sample Mean Sample Standard Deviation New 36 75.1667 17.2105 56 0.80 1.6025 10.2308 0 1.7786 Last Year 36 69.2500 10.1090 New-Last Year 36 5.9167 23.3243

MATLAB: An Introduction with Applications
6th Edition
ISBN:9781119256830
Author:Amos Gilat
Publisher:Amos Gilat
Chapter1: Starting With Matlab
Section: Chapter Questions
Problem 1P

Related questions
Question
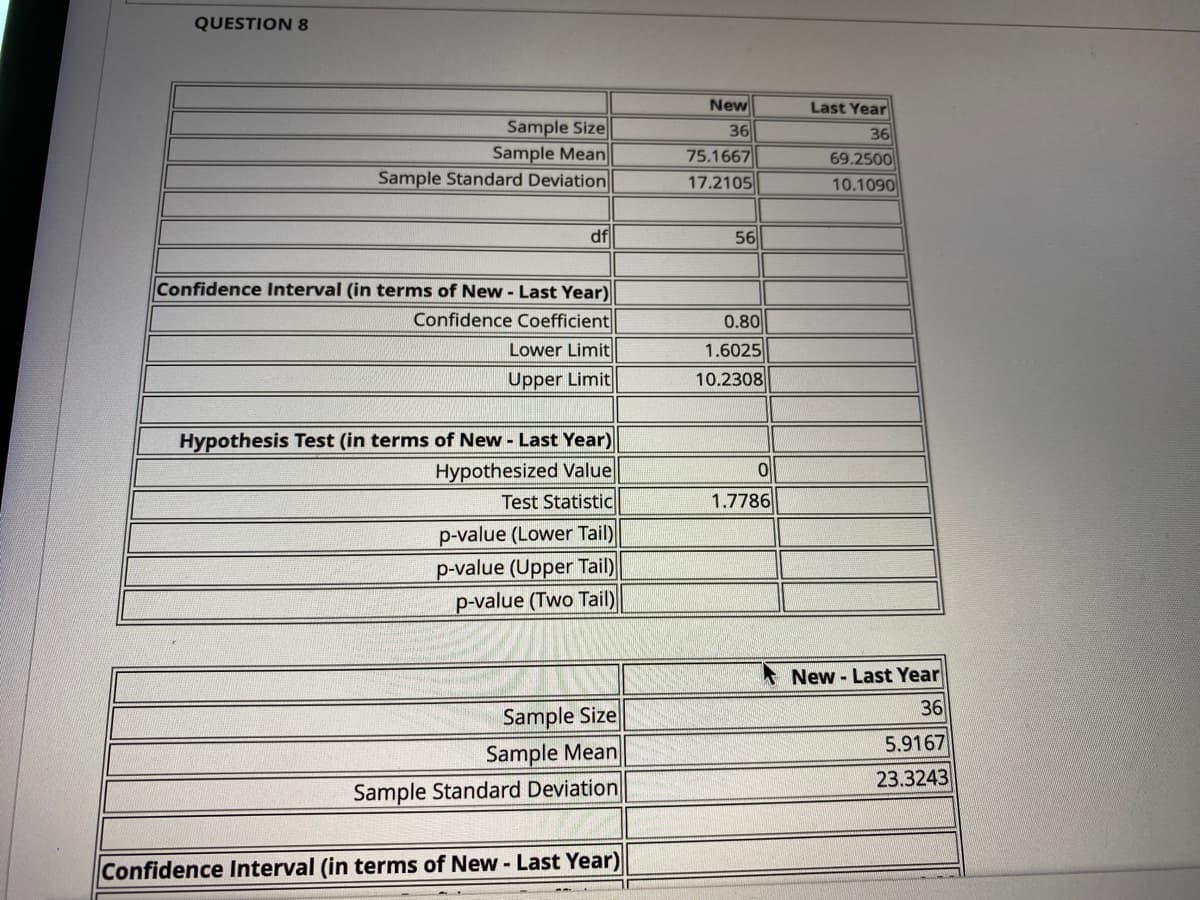
Transcribed Image Text:QUESTION 8
Sample Size
Sample Mean
Sample Standard Deviation
df
Confidence Interval (in terms of New - Last Year)
Confidence Coefficient
Lower Limit
Upper Limit
Hypothesis Test (in terms of New - Last Year)
Hypothesized Value
Test Statistic
p-value (Lower Tail)
p-value (Upper Tail)
p-value (Two Tail)
Sample Size
Sample Mean
Sample Standard Deviation
Confidence Interval (in terms of New - Last Year)
New
36
75.1667
17.2105
56
0.80
1.6025
10.2308
0
1.7786
Last Year
36
69.2500
10.1090
New-Last Year
36
5.9167
23.3243
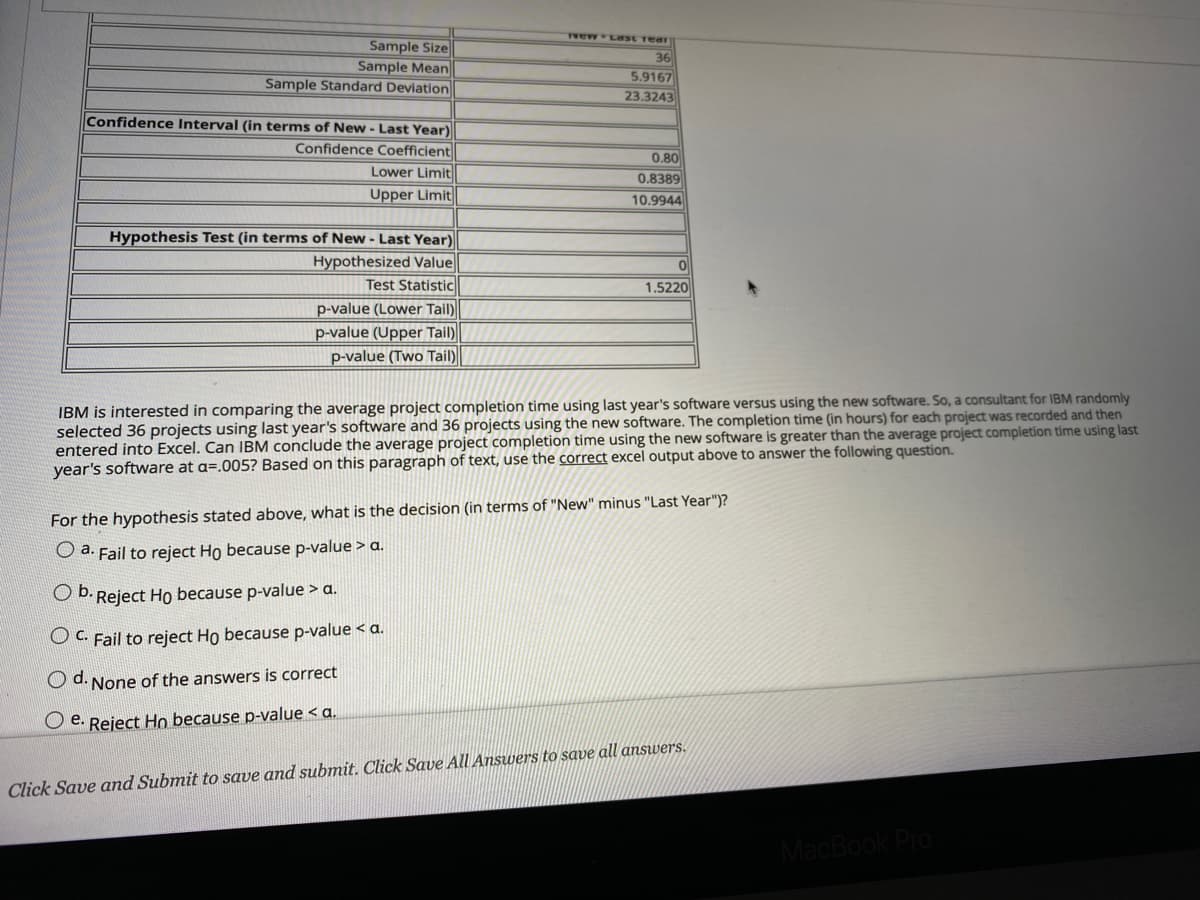
Transcribed Image Text:Sample Size
Sample Mean
Sample Standard Deviation
Confidence Interval (in terms of New - Last Year)
Confidence Coefficient
Lower Limit
Upper Limit
Hypothesis Test (in terms of New - Last Year)
Hypothesized Value
Test Statistic
p-value (Lower Tail)
p-value (Upper Tail)
p-value (Two Tail)
New Last Tear
36
5.9167
23.3243
0.80
0.8389
10.9944
0
1.5220
IBM is interested in comparing the average project completion time using last year's software versus using the new software. So, a consultant for IBM randomly
selected 36 projects using last year's software and 36 projects using the new software. The completion time (in hours) for each project was recorded and then
entered into Excel. Can IBM conclude the average project completion time using the new software is greater than the average project completion time using last
year's software at a=.005? Based on this paragraph of text, use the correct excel output above to answer the following question.
For the hypothesis stated above, what is the decision (in terms of "New" minus "Last Year")?
O a. Fail to reject Ho because p-value > a.
b.
Reject Ho because p-value > a.
OC. Fail to reject Ho because p-value < a.
Od. None of the answers is correct
Oe. Reject Hn because p-value < a.
Click Save and Submit to save and submit. Click Save All Answers to save all answers.
MacBook Pro
Expert Solution
This question has been solved!
Explore an expertly crafted, step-by-step solution for a thorough understanding of key concepts.

Step by step
Solved in 2 steps with 1 images

Recommended textbooks for you
MATLAB: An Introduction with Applications
Statistics
ISBN:
9781119256830
Author:
Amos Gilat
Publisher:
John Wiley & Sons Inc

Probability and Statistics for Engineering and th…
Statistics
ISBN:
9781305251809
Author:
Jay L. Devore
Publisher:
Cengage Learning

Statistics for The Behavioral Sciences (MindTap C…
Statistics
ISBN:
9781305504912
Author:
Frederick J Gravetter, Larry B. Wallnau
Publisher:
Cengage Learning
MATLAB: An Introduction with Applications
Statistics
ISBN:
9781119256830
Author:
Amos Gilat
Publisher:
John Wiley & Sons Inc
Probability and Statistics for Engineering and th…
Statistics
ISBN:
9781305251809
Author:
Jay L. Devore
Publisher:
Cengage Learning
Statistics for The Behavioral Sciences (MindTap C…
Statistics
ISBN:
9781305504912
Author:
Frederick J Gravetter, Larry B. Wallnau
Publisher:
Cengage Learning

Elementary Statistics: Picturing the World (7th E…
Statistics
ISBN:
9780134683416
Author:
Ron Larson, Betsy Farber
Publisher:
PEARSON

The Basic Practice of Statistics
Statistics
ISBN:
9781319042578
Author:
David S. Moore, William I. Notz, Michael A. Fligner
Publisher:
W. H. Freeman

Introduction to the Practice of Statistics
Statistics
ISBN:
9781319013387
Author:
David S. Moore, George P. McCabe, Bruce A. Craig
Publisher:
W. H. Freeman