Your employer, Getting Bigger All The Time, Inc. (GBATT), a multinational corporation headquartered in the United States of America, is looking to expand operations into Brazil. GBATT manufacturers a variety of materials used in the residential and commercial building industries. The Brazilian economy has been expanding and sales of GBATT materials to Brazilian companies have greatly increased. GBATT is exploring the possibility of building a new manufacturing facility in Brazil, not only to meet the increasing Brazilian demand, but also in anticipation of increased demand in other South American and Latin American countries once the global recession is completely over.
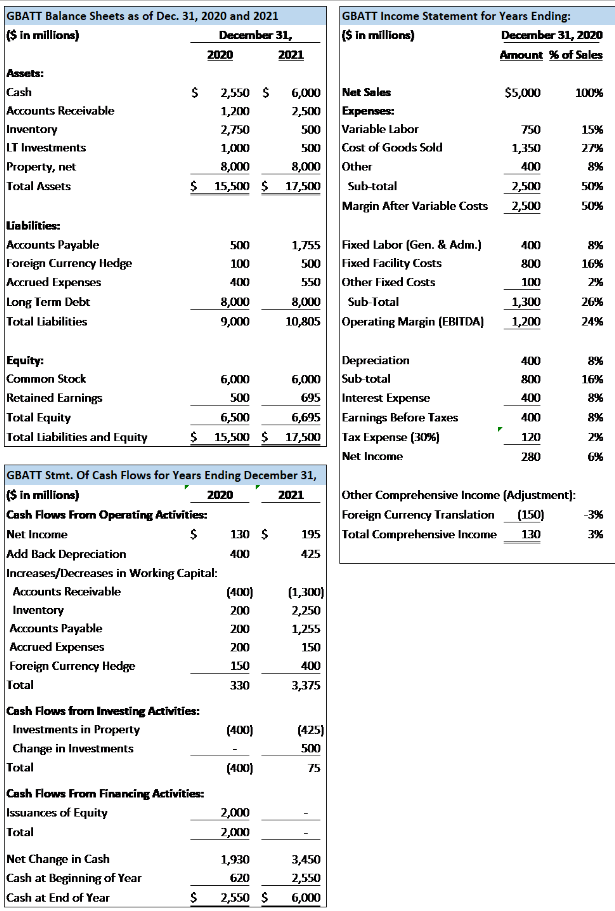
The following is a basic balance sheet, income statement and cash flow statements as of the last two year ends and for the last two years of operations. (file attached)
QUESTION
Analyze GBATT’s operational performance by describing its year over year performance.
Transcribed Image Text:GBATT Balance Sheets as of Dec. 31, 2020 and 2021
($ in millions)
December 31,
Assets:
Cash
Accounts Receivable
Inventory
LT Investments
Property, net
Total Assets
Liabilities:
Accounts Payable
Foreign Currency Hedge
Accrued Expenses
Long Term Debt
Total Liabilities
Equity:
Common Stock
Retained Earnings
Total Equity
Total Liabilities and Equity
Accounts Receivable
Inventory
Accounts Payable
Accrued Expenses
Foreign Currency Hedge
Total
$
2,550 $
6,000
1,200
2,500
2,750
500
1,000
500
8,000
8,000
$ 15,500 $ 17,500
Net Change in Cash
Cash at Beginning of Year
Cash at End of Year
Cash Flows from Investing Activities:
Investments in Property
Change in Investments
Total
2020
Cash Flows From Financing Activities:
Issuances of Equity
Total
500
100
400
8,000
9,000
$
6,000
500
GBATT Stmt. Of Cash Flows for Years Ending December 31,
($ in millions)
2020
2021
Cash Flows From Operating Activities:
Net Income
$
Add Back Depreciation
Increases/Decreases in Working Capital:
6,500
6,695
$ 15,500 $ 17,500
130 $
400
(400)
200
200
200
150
330
(400)
2021
(400)
2,000
2,000
1,930
620
2,550 $
6,000
695
1,755
500
550
8,000
Sub-Total
10,805 Operating Margin (EBITDA)
195
425
(1,300)
2,250
1,255
150
400
3,375
(425)
500
75
GBATT Income Statement for Years Ending:
($ in millions)
3,450
2,550
6,000
Net Sales
Expenses:
Variable Labor
Cost of Goods Sold
Other
Sub-total
Margin After Variable Costs
Fixed Labor (Gen. & Adm.)
Fixed Facility Costs
Other Fixed Costs
Depreciation
Sub-total
Interest Expense
Earnings Before Taxes
Tax Expense (30%)
Net Income
December 31, 2020
Amount % of Sales
$5,000
750
1,350
400
2,500
2,500
400
800
100
1,300
1,200
400
800
400
400
120
280
100%
Other Comprehensive Income (Adjustment):
Foreign Currency Translation (150)
Total Comprehensive Income 130
15%
27%
8%
50%
50%
8%
16%
2%
26%
24%
8%
16%
8%
8%
2%
6%
-3%
3%
Expert Solution
This question has been solved!
Explore an expertly crafted, step-by-step solution for a thorough understanding of key concepts.
Need a deep-dive on the concept behind this application? Look no further. Learn more about this topic, accounting and related others by exploring similar questions and additional content below.