Question Heip A call center data set shows that in a sample of 50 individuals, 17 had prior call center experience. If we assume that the probability that any potential hire will also have experience with a probability of 17/50, what is the probability that among te potential hires, more than half of them will have experience? Define the parameter(s) for this distribution based on the data Define the parameters for this distribution based on the data. Define a success as a new hire having experience When defining the number of successes, consider what value is necessary if one is going Select the correct choice below and fill imthe answer box(es) to complete your choice, find the area to the left of that value. O A. This distribution is a binomial distribution with parameters n= (Simplify your answers.) and p = O B. This distribution is a Poisson distribution with parameter A = (Simplify your answer.) O C. This distribution is a Bernoulli distribution with parameter p= (Simplify your answer.) Question Viewer
Question Heip A call center data set shows that in a sample of 50 individuals, 17 had prior call center experience. If we assume that the probability that any potential hire will also have experience with a probability of 17/50, what is the probability that among te potential hires, more than half of them will have experience? Define the parameter(s) for this distribution based on the data Define the parameters for this distribution based on the data. Define a success as a new hire having experience When defining the number of successes, consider what value is necessary if one is going Select the correct choice below and fill imthe answer box(es) to complete your choice, find the area to the left of that value. O A. This distribution is a binomial distribution with parameters n= (Simplify your answers.) and p = O B. This distribution is a Poisson distribution with parameter A = (Simplify your answer.) O C. This distribution is a Bernoulli distribution with parameter p= (Simplify your answer.) Question Viewer

Big Ideas Math A Bridge To Success Algebra 1: Student Edition 2015
1st Edition
ISBN:9781680331141
Author:HOUGHTON MIFFLIN HARCOURT
Publisher:HOUGHTON MIFFLIN HARCOURT
Chapter11: Data Analysis And Displays
Section: Chapter Questions
Problem 3CA

Related questions

Concept explainers
Contingency Table
A contingency table can be defined as the visual representation of the relationship between two or more categorical variables that can be evaluated and registered. It is a categorical version of the scatterplot, which is used to investigate the linear relationship between two variables. A contingency table is indeed a type of frequency distribution table that displays two variables at the same time.
Binomial Distribution
Binomial is an algebraic expression of the sum or the difference of two terms. Before knowing about binomial distribution, we must know about the binomial theorem.
Topic Video
Question
8)
Transcribed Image Text:tlon Help
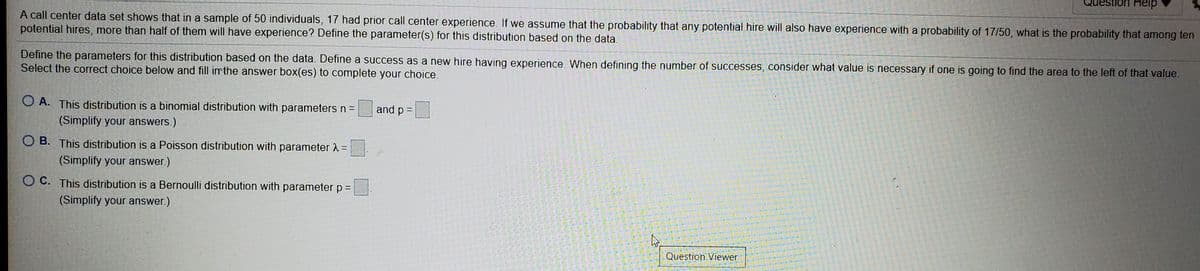
A call center data set shows that in a sample of 50 individuals, 17 had prior call center experience. If we assume that the probability that any potential hire will also have experience with a probability of 17/50, what is the probability that among ten
potential hires, more than half of them will have experience? Define the parameter(s) for this distribution based on the data.
Define the parameters for this distribution based on the data. Define a success as a new hire having experience. When defining the number of successes, consider what value is necessary if one is going to find the area to the left of that value.
Select the correct choice below and fill in the answer box(es) to complete your choice.
O A. This distribution is a binomial distribution with parameters n =
and p =
(Simplify your answers.)
O B. This distribution is a Poisson distribution with parameter 2 =
(Simplify your answer.)
O C. This distribution is a Bernoulli distribution with parameter p =
%3D
(Simplify your answer.)
Question Viewer
Expert Solution
This question has been solved!
Explore an expertly crafted, step-by-step solution for a thorough understanding of key concepts.

This is a popular solution!

Trending now
This is a popular solution!

Step by step
Solved in 2 steps with 2 images

Knowledge Booster


Learn more about
Need a deep-dive on the concept behind this application? Look no further. Learn more about this topic, statistics and related others by exploring similar questions and additional content below.Recommended textbooks for you
Big Ideas Math A Bridge To Success Algebra 1: Stu…
Algebra
ISBN:
9781680331141
Author:
HOUGHTON MIFFLIN HARCOURT
Publisher:
Houghton Mifflin Harcourt
Big Ideas Math A Bridge To Success Algebra 1: Stu…
Algebra
ISBN:
9781680331141
Author:
HOUGHTON MIFFLIN HARCOURT
Publisher:
Houghton Mifflin Harcourt